
Standardize best practices across plants and shifts.
Many factories suffer from shift-to-shift inconsistency—different routines, standards, and discipline levels that kill yield and quality. BRAINR enforces identical SOPs across all plants and shifts, delivering the same guided steps to every operator and capturing KPIs uniformly for true performance comparability.
Key Challenges in Standardizing Operational Best Practices, Solved with BRAINR
.avif)
Procedures vary depending on shift, team or plant

SOPs exist on paper but are not enforced
KPIs are collected differently from one place to another
Core BRAINR Features for Standardization
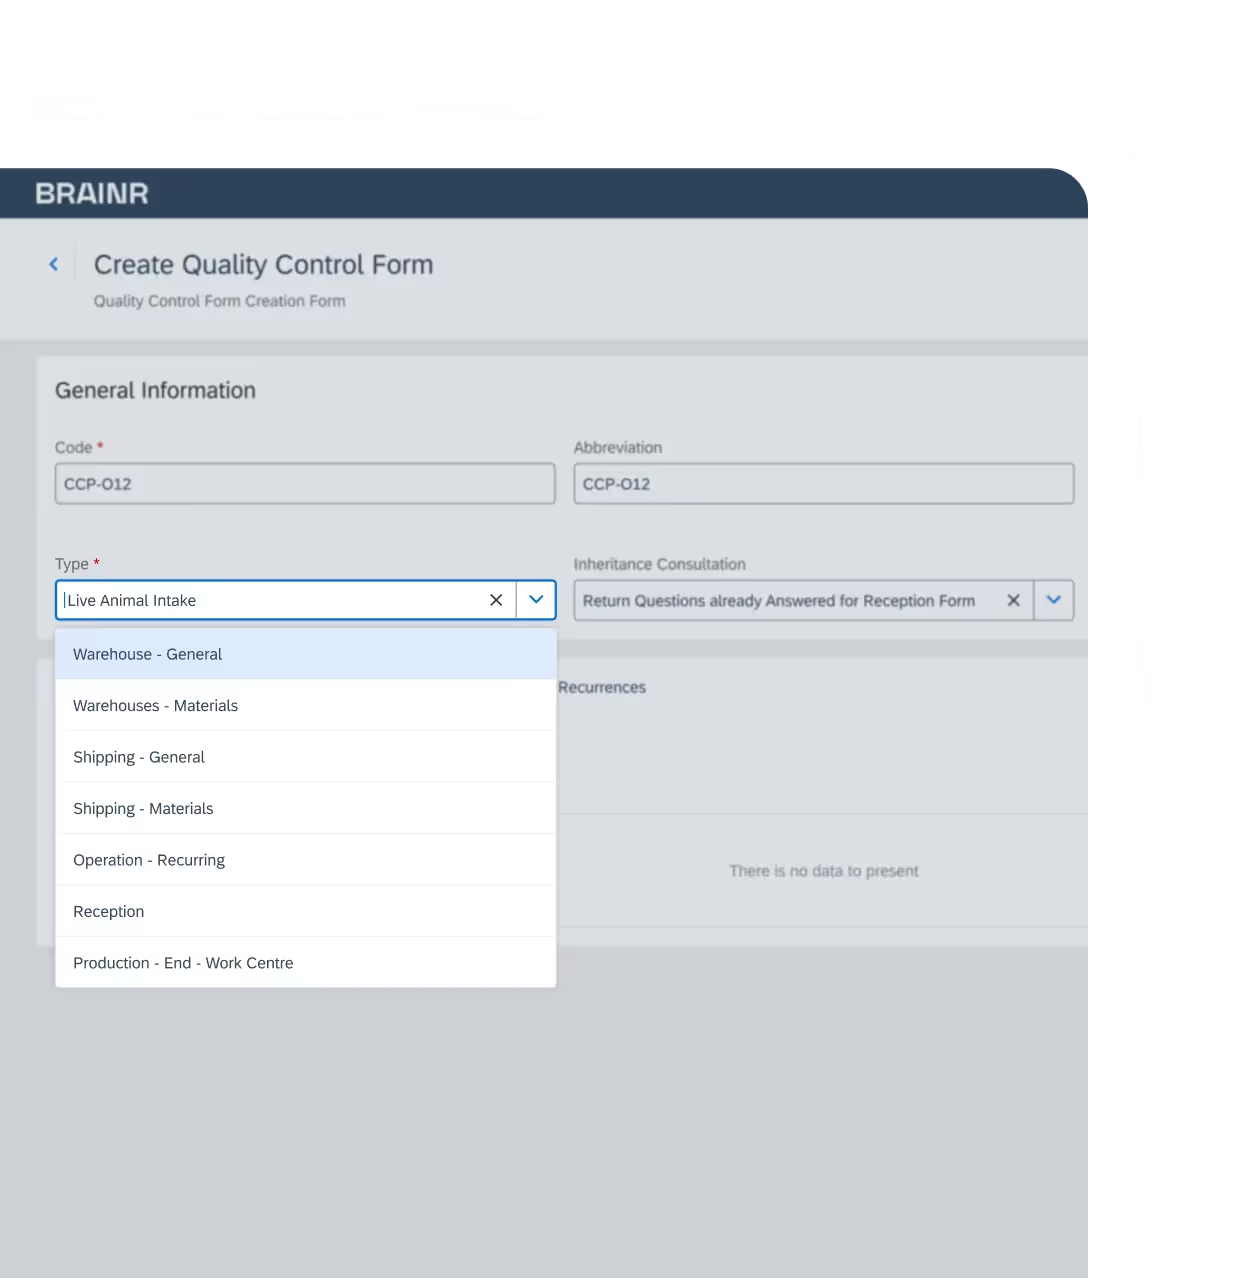
Digital SOPs configured and enforced across sites
All procedures are centrally defined in BRAINR and deployed to every plant, line and shift — ensuring consistency across the entire operation.
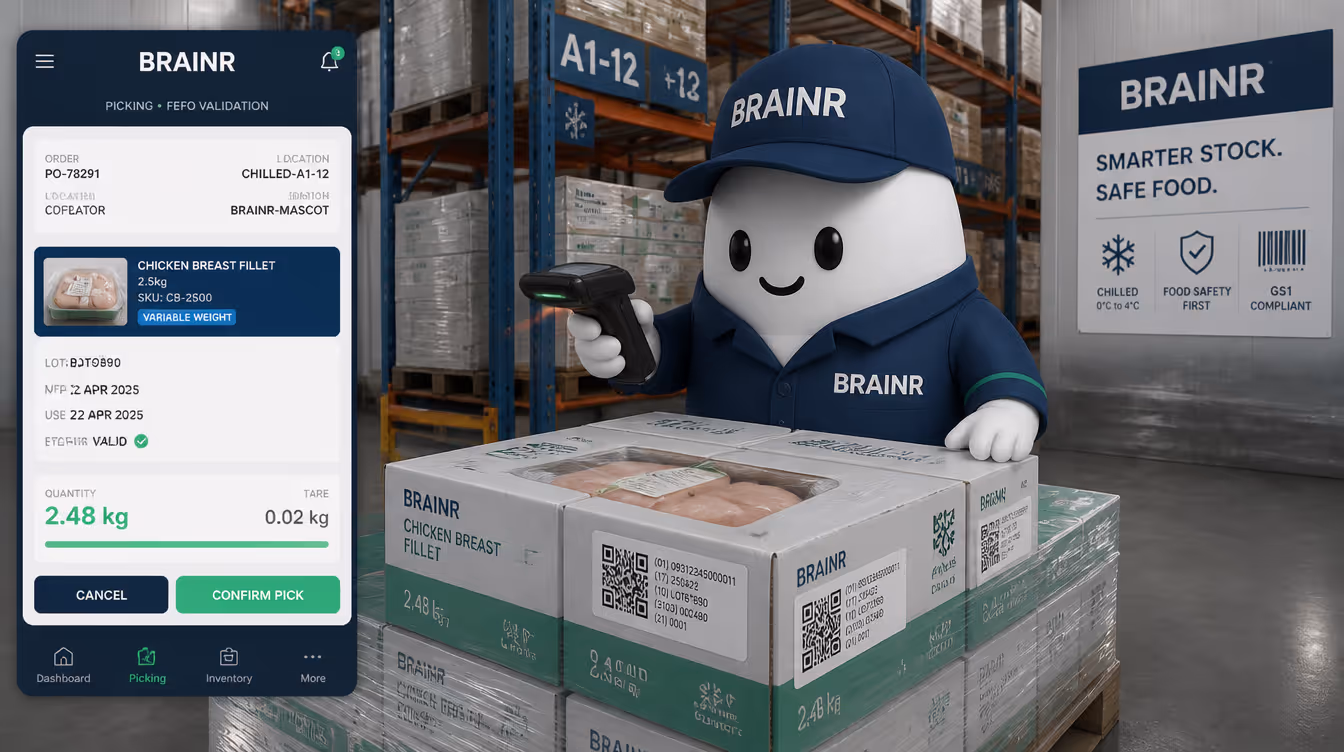
Guided mobile workflows for operators
Operators follow clear instructions in the app for each SOP step. No improvisation, no shortcuts, no different "local versions".
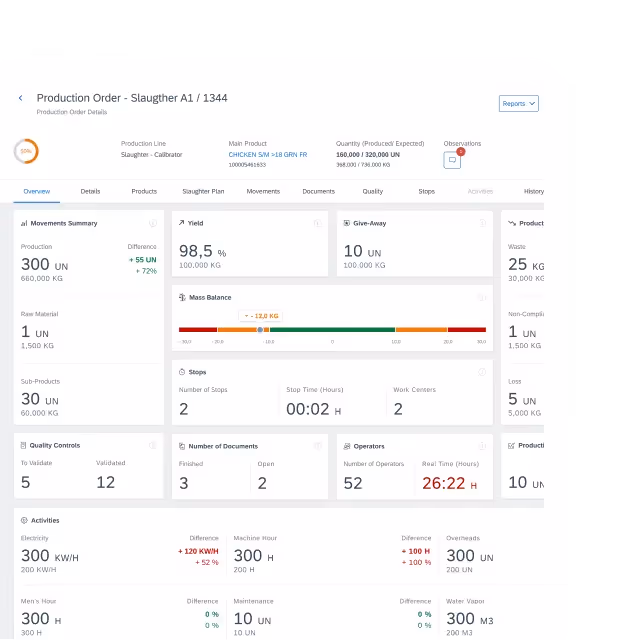
Consistent KPI capture
All performance indicators — yield, waste, giveaways, cycle times, quality checks — are measured in the same way everywhere.
Real-time visibility of compliance
Supervisors can see whether SOPs were followed and where deviations occurred, enabling immediate corrective actions.
Scalable replication from one plant to many
Best-performing procedures can be rolled out to other factories with a single configuration change, creating organization-wide standardization.
Centralised data management
Products, labels, QC forms, CCPs and instructions pull from the same database, ensuring that no plant operates with outdated or incorrect information.
Why BRAINR is Different
Enforces execution, not just documentation
Most systems store SOPs. BRAINR ensures each step is actually completed — in the right sequence and with the correct validation.
True comparability across sites and shifts
Because all procedures and KPIs are standardized, performance differences can be understood clearly and objectively.
From local optimization to global excellence
Once a plant proves a better method, BRAINR allows the same standard to be replicated instantly across the entire group.
How It Works in Practice
How does it work in practice?
Configure SOPs centrally
All procedures, QC checks, and validations are created once and pushed to every plant.
Operators follow guided steps
Mobile workflows ensure each step is followed and recorded the same way across all shifts and locations.
Compare results across sites
Standardized KPIs let teams see which plant, shift or line performs best — and why — driving continuous improvement.
What our clients say
reduction of time spent on quality and traceability tasks

increase in daily bird slaughter volume without loosing control

reduction of time spent on quality and traceability reporting

.svg)

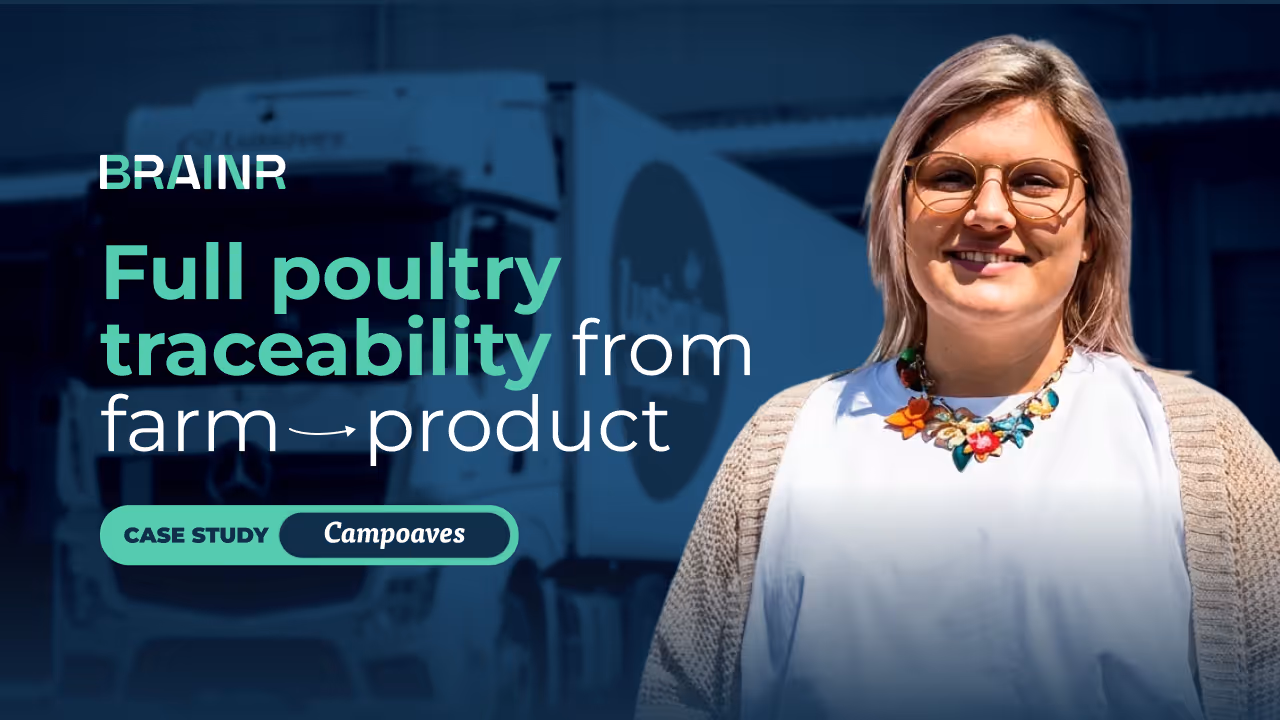
From Full Traceability to IFS Certification: The Success Story of Campoaves Viseu + BRAINR
Campoaves Viseu is a Portuguese poultry processing company producing 100% fresh products for major retailers, fully digitised with BRAINR in 4 months and IFS certified.

Campoaves: Digitizing Complex Poultry Operations with BRAINR MES/MOM
"With BRAINR’s digitalization, controlling production orders became much more dynamic, helping us avoid waste of raw materials and labor."

Stay Ahead with Fresh Insights
Dive into our blog for stories, lessons, and behind-the-scenes insights from real projects. It’s where we share what’s working — and what we’ve learned along the way.


FAQs — Standardizing Best Practices
Quick Answers for Curious Minds

Yes. SOPs become step-by-step workflows that operators must complete in sequence, ensuring full compliance.
By guiding every operator through digital instructions and capturing each step as it happens.
Yes. Update once, deploy everywhere — instantly.
Absolutely. KPIs are collected identically, making cross-plant comparisons accurate and meaningful.
Yes. Quality checks, CCP validations and QC forms are integrated into the workflows.
By ensuring every shift follows the same process, reducing inconsistency in yield, quality and efficiency.
We know your struggles. They once were ours.
We understand the challenges you face because we've been there too. Our journey has taught us valuable lessons that we're eager to share.