


Increase the yield of your food factory, consistently.
We built BRAINR to simplify production in the food industry. No more paper chaos, missed deadlines, or audit stress, just one system that connects people, machines, and ERP so you can grow profitably and with peace of mind.


Poultry
One platform. Every operation.
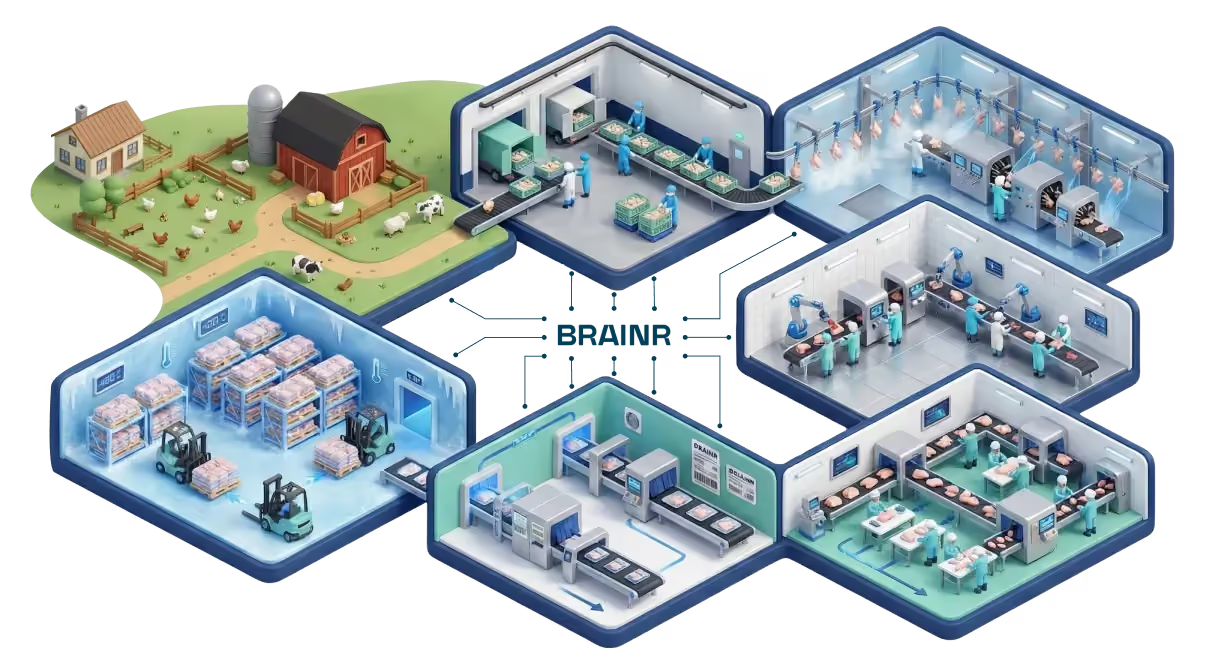
Slaughter & Primary Processing
Make slaughter decisions with live farm and intake data connected to plant execution.
- ·Link each flock to slaughter timing, line allocation, and downstream processing
- ·See live throughput, live weights, carcass weights, and early yield indicators
- ·Detect when a flock is performing below expectation and adjust faster
Weighing / Packing / Labeling
Control giveaway, labeling accuracy, and order execution in real time.
- ·Connect weighing, packing, and labeling stations to live production data
- ·Monitor giveaway by SKU, format, customer, and line
- ·Reduce manual errors by replacing paper and Excel with guided digital workflows
Cut-up & Deboning
Turn cut-up into a measurable yield engine, not a black box.
- ·Track yield by line, shift, product, operator team, flock, and batch
- ·Compare expected vs actual output by part: breast, thigh, wing, fillet, etc.
- ·Identify where yield is being lost and which combinations of flock + line + shift perform best
Evisceration
Track the first major yield and quality signals where losses start becoming visible.
- ·Monitor line performance, downgrades, rejects, and quality deviations in real time
- ·Capture causes of loss directly on the line through mobile or workstation input
- ·Relate evisceration outcomes back to flock, supplier, shift, and team
Live Bird Receiving
Digitize intake at reception so the plant starts with real data, not assumptions.
- ·Register trucks, farms, flocks, batches, weights, and arrival times in real time
- ·Validate what was planned vs what actually arrived
- ·Trigger better slaughter sequencing based on actual bird characteristics, not yesterday’s spreadsheet
Cold Storage & Dispatch
Keep traceability and inventory control intact after production leaves the line.
- ·Track finished goods by batch, pallet, location, status, and customer order
- ·Know exactly what was produced, packed, stored, picked, and shipped
- ·Improve dispatch accuracy and speed with mobile-native warehouse workflows
Pork & Beef
One platform. Every operation.

Slaughter / Kill Floor
Track slaughter execution in real time to maintain throughput and ensure reliable batch traceability.
- ·Monitor slaughter throughput and line performance
- ·Connect carcasses to supplier and intake batches
- ·Detect deviations early before they impact downstream yield
Deboning & Portioning
Turn deboning operations into measurable production lines with clear yield and productivity visibility.
- ·Track yield by product, line, shift, and raw material batch
- ·Monitor labor productivity and output in real time
- ·Identify trimming losses and performance gaps
Primary Cutting / Butchery
Measure primal cut production to improve cutting performance and yield visibility.
- ·Track production of key primals such as ham, loin, shoulder, and belly
- ·Compare expected vs actual yield by batch and shift
- ·Identify performance differences across lines and teams
Carcass Dressing & Splitting
Capture the first reliable carcass data to monitor yield, grading, and processing consistency.
- ·Record carcass weights and classification automatically
- ·Track yield performance by supplier and batch
- ·Detect quality or processing deviations early
Live Hog Receiving & Lairage
Digitize hog intake and connect supplier and batch data to downstream slaughter operations for better planning and traceability.
- ·Register trucks, suppliers, and lots at reception
- ·Capture real intake weights and arrival times
- ·Link animals to slaughter batches and production planning
Cold Storage & Logistics
Maintain full control of finished goods movement and traceability after production.
- ·Track palletized inventory by batch and product
- ·Manage stock movements, picking, and dispatch
- ·Ensure traceability from supplier to shipment
Fish & Seafood
One platform. Every operation.

Washing & Initial Handling
- ·Track batches entering processing lines
- ·Monitor throughput and raw material handling
- ·Maintain batch integrity from intake to processing
Monitor washing and first sorting operations to maintain quality and processing flow.
Packaging
- ·Monitor product weights and packaging output
- ·Ensure correct labeling and batch traceability
- ·Reduce manual errors by replacing paper tracking
Digitize packaging operations to ensure accurate labeling, weights, and traceability.
Trimming & Portioning
- ·Track yield by product, batch, line, and shift
- ·Monitor labor productivity and processing output
- ·Identify trimming losses and improvement opportunities
Turn trimming and portioning into measurable production steps with real yield visibility.
Primary Processing / Filleting
- ·Monitor processing throughput and line efficiency
- ·Track yield from whole fish to fillets
- ·Detect deviations in processing performance early
Track filleting operations to measure yield and line performance as raw fish becomes fillets.
Receiving & Raw Fish Intake
- ·Register trucks, vessels, or suppliers and incoming batches
- ·Capture intake weights and lot information in real time
- ·Establish full traceability from raw material to finished product
Digitize fish reception to capture supplier, batch, and weight data as product enters the plant.
Cold Storage & Logistics
- ·Track palletized inventory by batch and product
- ·Manage storage locations and stock movements
- ·Ensure traceability from raw fish intake to shipment
Maintain visibility over finished goods and shipments after production.
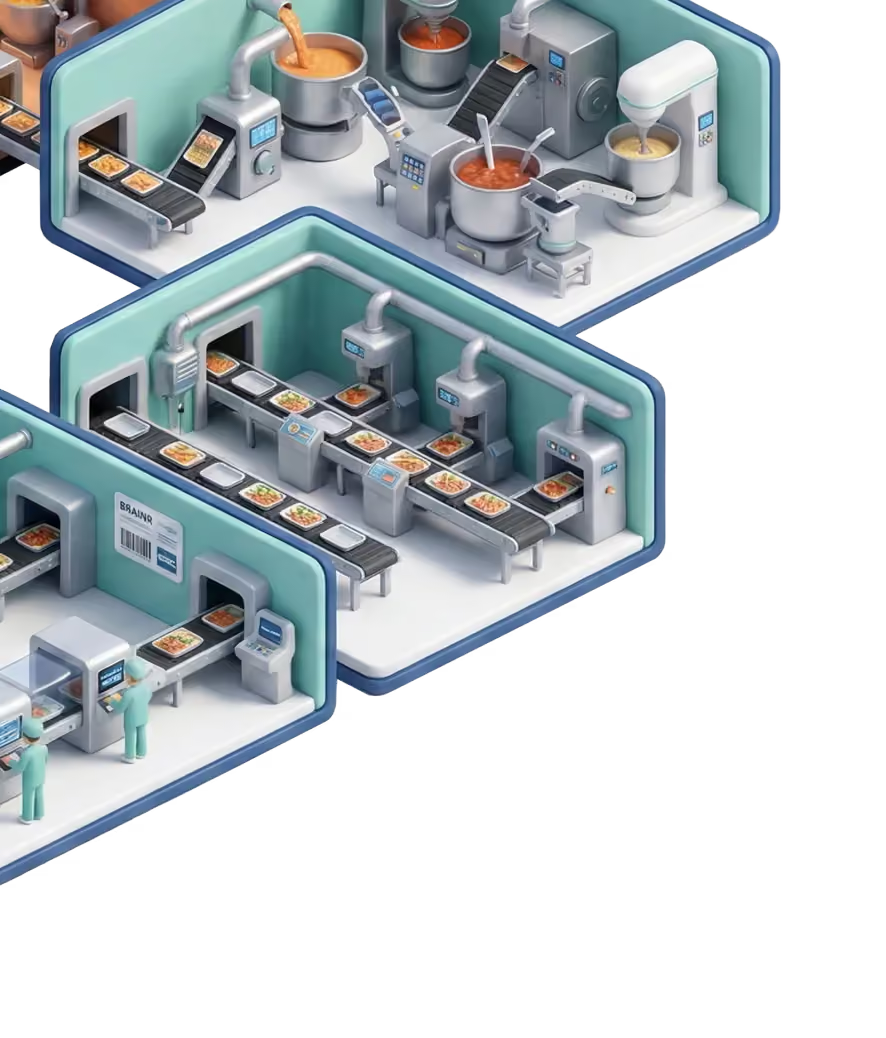
Pre-cooked & Ready Meals
One platform. Every operation.

Cooking / Thermal Processing
- ·Track cooking batches, temperatures, and processing times
- ·Monitor production throughput across cooking lines
- ·Ensure consistent execution of recipes and processing steps
Monitor cooking operations to ensure consistent product quality and controlled processing conditions.
Packaging & Sealing
- ·Monitor packaging throughput and line performance
- ·Ensure correct labeling and product identification
- ·Maintain traceability between production batches and packaged meals
Digitize packaging operations to ensure accurate labeling, sealing, and batch traceability.
Portioning & Tray Filling
- ·Monitor portion weights and product consistency
- ·Track production output by line and shift
- ·Reduce giveaway and improve portion accuracy
Ensure consistent portioning and efficient line execution during meal assembly.
Mixing & Recipe Processing
- ·Track recipe batches and ingredient consumption
- ·Validate recipe compliance during production
- ·Monitor batch yields and processing efficiency
Control ingredient mixing and recipe execution with real-time production visibility.
Raw Ingredient Preparation
- ·Register raw materials, suppliers, and batch numbers
- ·Track ingredient preparation and availability in real time
- ·Maintain traceability from raw ingredients to finished meals
Digitize ingredient intake and preparation to ensure accurate recipe execution and full batch traceability.
Cold Storage & Logistics
- ·Track finished product inventory by batch and SKU
- ·Manage storage locations and dispatch preparation
- ·Ensure full traceability from ingredient to shipment
Maintain visibility over finished goods after production and during distribution.
Industrial Bakery
One platform. Every operation.

Mixing & Dough Preparation
- ·Track mixing batches, recipes, and ingredient consumption
- ·Monitor mixing times and production throughput
- ·Ensure consistent dough preparation across shifts and lines
Monitor mixing operations to ensure consistent dough quality and controlled batch execution.
Cooling
- ·Track batches through cooling tunnels and lines
- ·Ensure proper cooling times before packing
- ·Maintain product traceability during transition to packaging
Monitor cooling operations to maintain product integrity before packaging.
Baking
- ·Track oven batches, baking times, and production throughput
- ·Monitor oven line performance and product flow
- ·Detect deviations that may impact final product quality
Ensure baking conditions and throughput are monitored to maintain product quality and efficiency.
Dough Forming & Shaping
- ·Track batches as dough moves through forming lines
- ·Monitor production output and line performance
- ·Identify deviations affecting product consistency
Control forming operations to maintain consistent product size, shape, and production flow.
Ingredient Handling & Dosing
- ·Register suppliers, batches, and ingredient deliveries
- ·Track ingredient usage by recipe and production batch
- ·Maintain traceability from raw ingredients to finished products
Digitize ingredient intake and dosing to ensure accurate recipes and full traceability of raw materials.
Packaging
- ·Monitor packaging throughput and line efficiency
- ·Ensure correct labeling and product identification
- ·Maintain traceability between production batches and packaged goods
Digitize packaging operations to ensure accurate labeling, traceability, and production visibility.
Fruits & Vegetables
One platform. Every operation.

Washing & Sorting
- ·Track batches entering processing lines
- ·Record quality checks and sorting results
- ·Maintain traceability from intake through processing
Monitor washing and sorting operations to ensure quality and maintain batch integrity during early processing stages.
Packaging
- ·Monitor packaging throughput and line efficiency
- ·Ensure correct labeling and product identification
- ·Link packaged products to processing batches
Digitize packaging operations to ensure accurate labeling and batch traceability.
Thermal Processing (Blanching / Cooking)
- ·Track batches entering blanching or cooking operations
- ·Monitor processing parameters and throughput
- ·Maintain traceability between raw and processed batches
Control thermal processing steps to maintain product quality and food safety.
Cutting / Peeling / Processing
- ·Monitor processing throughput and line performance
- ·Track yield from raw produce to processed product
- ·Detect deviations affecting product quality and output
Track processing operations where raw produce is transformed into prepared products.
Receiving & Raw Material Intake
- ·Register suppliers, farms, and incoming batches
- ·Capture intake weights and lot identification
- ·Establish full traceability from farm to finished product
Digitize produce intake to capture supplier, lot, and quality data as raw materials enter the facility.
Cold Storage & Distribution
- ·Track palletized inventory by batch and product
- ·Manage storage locations and dispatch preparation
- ·Ensure traceability from farm to shipment
Maintain visibility over finished goods and product movement after production.
Beverages
One platform. Every operation.

Mixing / Brewing / Formulation
- ·Track recipes, batches, and ingredient consumption
- ·Monitor mixing or brewing processes in real time
- ·Ensure consistent execution of beverage formulations
Control beverage formulation and batch execution with real-time production visibility.
Secondary Packaging
- ·Monitor packaging throughput and line efficiency
- ·Ensure correct labeling and packaging formats
- ·Maintain traceability between bottles and packaged cases
Ensure accurate labeling, packing, and product identification before distribution.
Bottling / Filling
- ·Track filling line performance and output in real time
- ·Monitor fill volumes and production batches
- ·Link filled bottles to processing batches and production runs
Digitize filling operations to monitor throughput, accuracy, and batch traceability.
Filtration & Processing
- ·Track filtration batches and processing throughput
- ·Monitor production flow across processing equipment
- ·Maintain traceability between processing batches and final product
Monitor processing steps that refine beverage quality before bottling.
Raw Material Receiving & Ingredient Handling
- ·Register raw materials, suppliers, and incoming batches
- ·Track ingredient availability for production planning
- ·Ensure traceability from raw materials to finished beverages
Digitize ingredient intake to capture supplier, batch, and quantity data as materials enter the plant.
Finished Goods Warehouse & Distribution
- ·Track palletized inventory by batch and SKU
- ·Manage warehouse locations and dispatch preparation
- ·Ensure traceability from ingredients to shipment
Maintain visibility over finished goods and product movements after production.

“After decades inside food factories, we saw leaders struggling with digitization. We’ve witnessed companies running +30 ERPs and +250 different operational softwares! BRAINR was built to cut through that noise and give leaders one clear way to run factories.”


Workers were let down by the very tools meant to help them.


Unlock Manufacturing Excellence for Everyone


Trucks leave on schedule. With BRAINR, I see order progress in real time and stay ahead of every shipment.
Teams stay productive even when shifts change. Clear digital guidance helps operators adapt quickly and confidently.
Production flows without surprises. Machines signal their condition early so I act before issues escalate.
Every gram counts. BRAINR tracks performance line by line so I protect margin and maximize output.

Every order leaves on schedule. I keep live control of every line and order, so nothing slips when the day turns unpredictable.
Downtime doesn't catch me off guard. Machines flag issues early, so I act before a stoppage costs the shift.
I see exactly where waste happens. Yield is tracked by line and shift, so losses get fixed, not repeated.
No more clipboards or spreadsheets. Orders, stock and people live in one system I can trust.

I retire the patchwork. Dozens of fragile tools become one cloud-native platform I actually control.
Connecting BRAINR is straightforward. ERP, labeling and machines link through ready-made connectors, not custom code.
Data stays protected by design. AWS backbone, encryption everywhere, SOC2/ISO-ready — no extra work for me.
Operators like using it, so I stop firefighting. Mobile apps people actually want to use mean fewer support calls.

Every control gets done, even under pressure. Digital QC makes sure nothing slips through, shift after shift.
Audits stop being stressful. Every record is traceable in seconds, not days of digging through paperwork.
Typos and guesswork disappear. Mobile forms with scanning capture the right data the first time.
If something goes wrong, I move fast. Traceability down to pallet and batch, in a single click.

I always know what to do next. Digital tasks on mobile remove the guesswork, step by step.
Mistakes on the line drop to zero. Scanning and validation confirm the right cut, box and label, every time.
I catch problems before they repeat. Live feedback flags mistakes early, so I don't redo the work later.
I record once, and it's shared everywhere automatically. No retyping, no paper trail to lose.

I see which station is lagging in real time. Live dashboards let me rebalance the line before it costs the shift.
Changeovers stop eating my day. Setup instructions on mobile cut line-change time dramatically.
Every operator gets precise digital tasks. There's no room left for unclear instructions.
I catch losses while they're still small. Real-time tracking means I fix problems before the shift ends.

Every shift protects the bottom line. Waste goes down, yield goes up, and profit stays protected.
I run every plant from one source of truth. Real-time performance data closes my blind spots on growth.
Compliance stops being a risk. Full digital traceability keeps regulators and customers confident in me.
I scale the business, not the complexity. One platform runs it all, without layers of IT overhead.
Main challenges that BRAINR helps solving

Plan and reschedule your productions effortlessly.

Make better slaughter decisions with real farm data.

Increase yield and reduce waste in every shift.

Protect animal welfare and meet regulatory expectations.
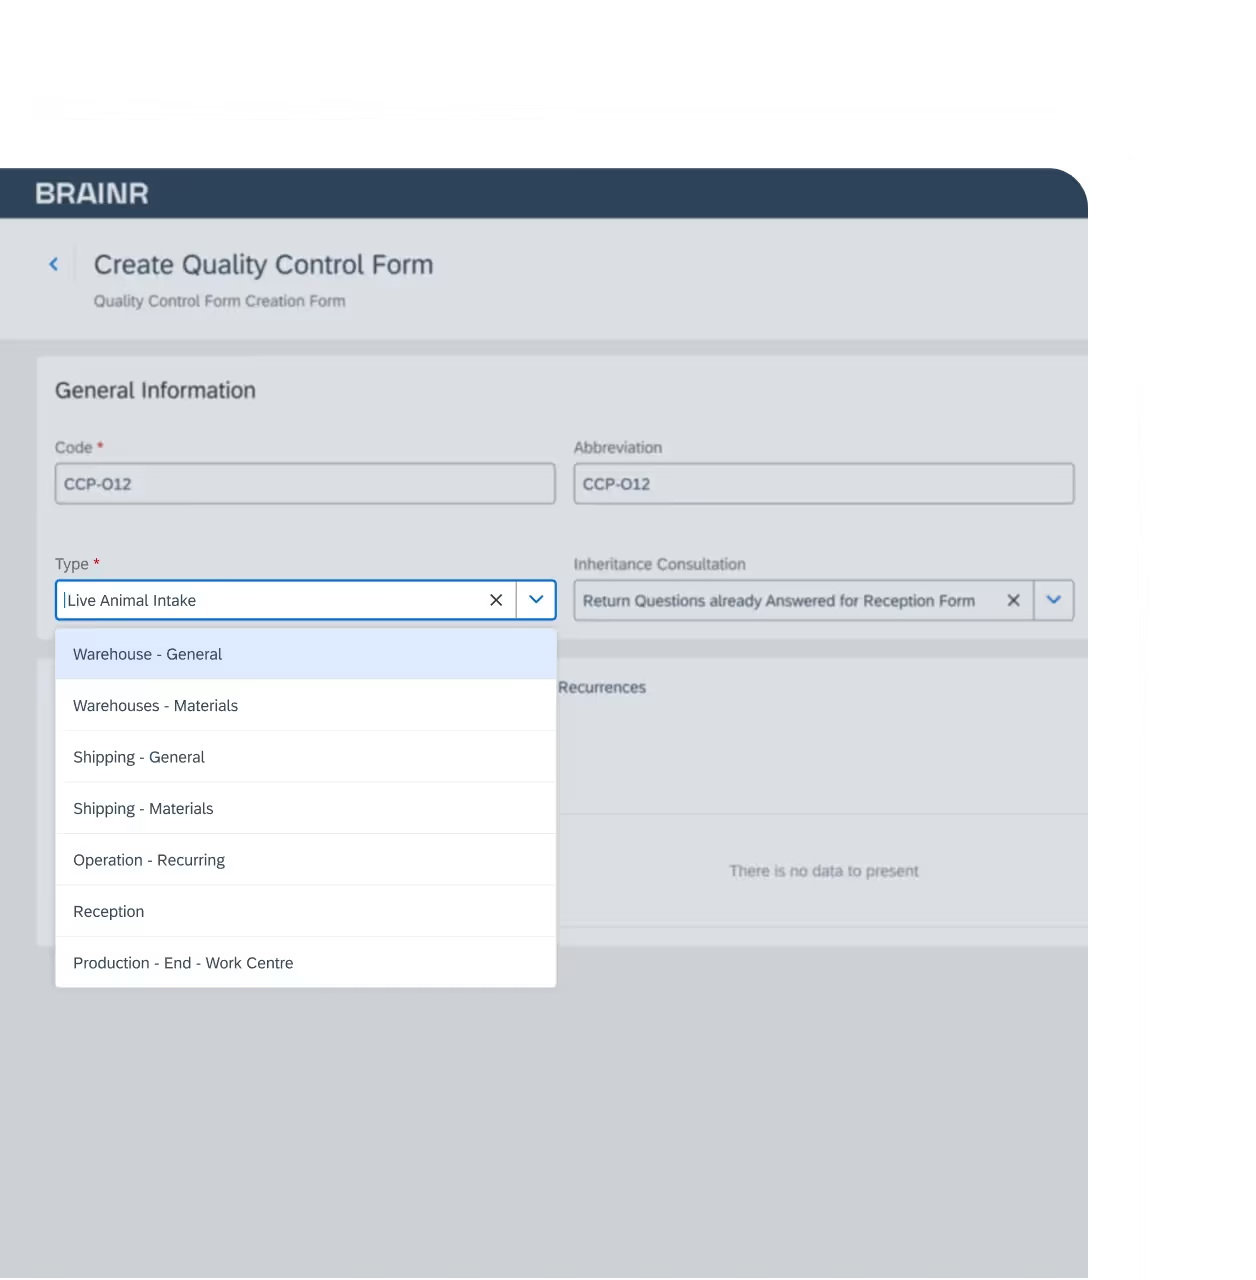
Standardize best practices across plants and shifts.

Simplify food safety compliance & audits (HACCP, BRC, IFS, FSMA).
BRAINR AI
Everything powered and automated by
Designed to think with you.
BRAINR AI is built to amplify how teams think, create, and decide. It transforms fragmented processes into seamless intelligence
Virtual Employees
Multiply your factory workforce with virtual employees
Virtual Assistant
An earpiece to let you talk with our software in real time
Reports & Summary
Plan your next production with unseen capabilities

AI-supported planning
Plan your next production with unseen capabilities


AI-powered live conversation
Ask your factory bot anything and get answers in real-time.
Integration with ERPs & third party softwares


Secure cloud native infrastructure
Mobile native apps for best user experience


Integration with equipment manufactures & IoT
Machines that talk and listen.
No-Code configurability & factory adaption
Use BRAINR in your factory without coding.
Powering smarter factories
Built on years of hands-on experience in food factories, these numbers show the real impact of connected, data-driven operations.

reduction of time spent on quality and traceability tasks

increase in daily bird slaughter volume without loosing control

reduction of time spent on quality and traceability reporting


Campoaves: Digitizing Complex Poultry Operations with BRAINR MES/MOM
"With BRAINR’s digitalization, controlling production orders became much more dynamic, helping us avoid waste of raw materials and labor."
You can do it, too. Achieve results in weeks.
You’re curious on how BRAINR can help you
You’ve seen what others have achieved with BRAINR, and you believe your factory can do it too. That’s where your transformation starts.

Get surprised on how we know about your factory
You know there’s more value hidden in your factory. Book a free consultation to explore what’s possible with BRAINR.
Discover the fastest path to manage your production digitally
Without any upfront investment, you’ll receive a real, data-driven assessment of where your operations can improve.
We’ll show you the full optimization potential.
Launch, iterate and see tangible results in weeks
You'll experience BRAINR's proprietery
methodology: Activ8.
No more waiting 6–12 months to see impact.
Together, we pick one area after another to deliver measurable results within weeks.

We know your struggles. They once were ours.
We understand the challenges you face because we've been there too. Our journey has taught us valuable lessons that we're eager to share.