
Make better slaughter decisions with real farm data.
BRAINR connects your slaughter planning to real farm information — flock uniformity, expected weights, predictions and farmer performance — so you stop planning on averages and start planning on reality.

Key Challenges in Slaughter & Live Animal Management, Solved with BRAINR
Planning based on averages instead of real weight distributions
Disconnect between farm, catch teams and slaughter
No feedback loop to improve future farming performance
Core BRAINR Features for Better Slaughter Decisions
Integration with farm software
Plan slaughter directly in BRAINR or import plans from the farmer’s system — quantities, expected weights, categories and flock details sync automatically.
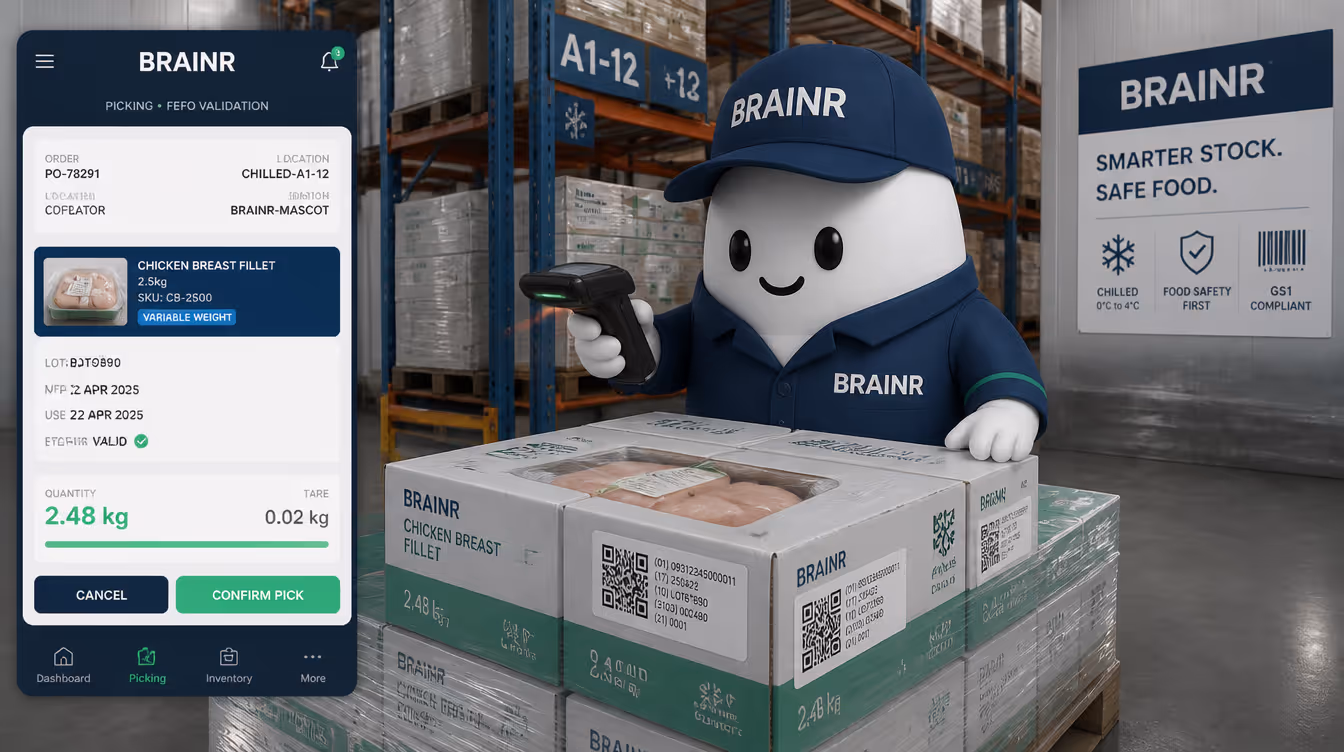
Automatic population of live-animal data at intake
When animals arrive, key information appears instantly in BRAINR without manual entry: farm, flock, expected weight, uniformity and batch ID.
Downgrade reduction with real size distributions
By planning with real predicted weight profiles, factories reduce downgrades in cutting and improve yield consistency.
Performance feedback loop
Actual slaughter data is sent back to compare farmer predictions, catch team results and flock uniformity against real outcomes.
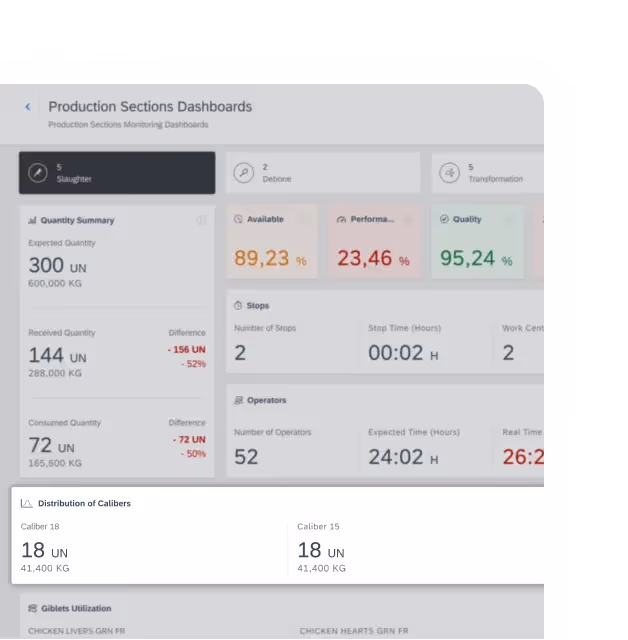
Visibility of uniformity and live weight deviation
Real-time dashboards show how each flock performs versus expectations, enabling better planning of cutting, packaging and labour.
Historical data for long-term improvement
The system stores all comparisons — predicted vs. actual — helping the entire chain optimize future deliveries.
Why BRAINR is Different
Real integration between farm data and slaughter planning
No more relying on averages. You plan with real predicted weight curves, uniformity, mortality and catch performance.
Automatic data capture at intake
Live-animal arrival populates instantly — no manual typing, no errors, no delays.
A closed loop between farm, catch teams and plant
Slaughter results flow back to the farmer and catch teams, creating continuous improvement for both upstream and downstream operations.
How it Works in Practice
How does it work in practice?
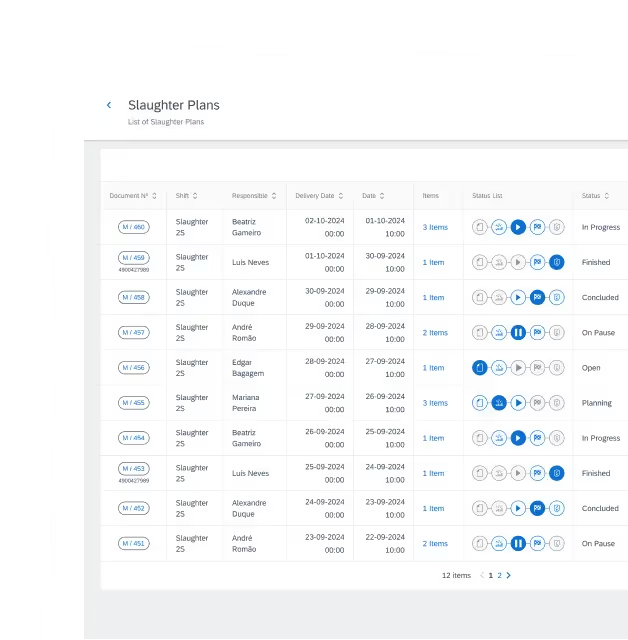
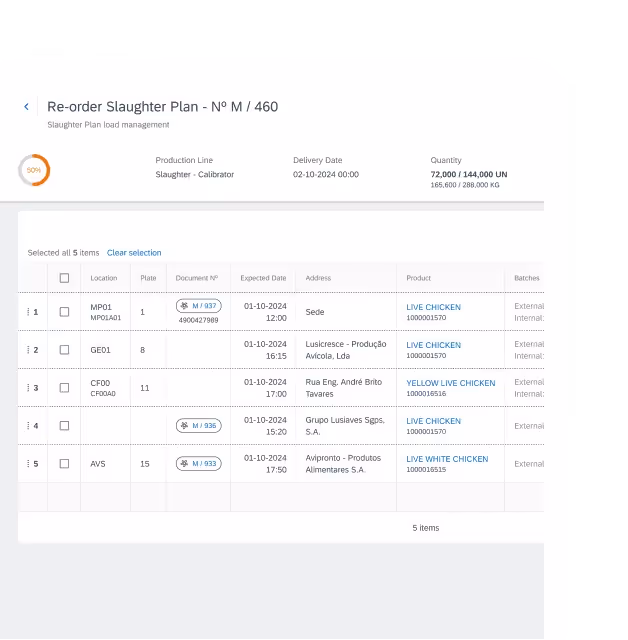
Import or create your slaughter plan
Pull farm predictions directly into BRAINR or plan inside the system — quantity, weight, distribution, categories.
Receive live animals with auto-populated data
Arrival data syncs automatically from the farmer's system: flock ID, predicted weights, uniformity and age.
Analyse actual vs. predicted results
BRAINR compares slaughter results with predictions to optimize cutting, reduce downgrades and improve future planning accuracy.
What our clients say
reduction of time spent on quality and traceability tasks

increase in daily bird slaughter volume without loosing control

reduction of time spent on quality and traceability reporting

.svg)

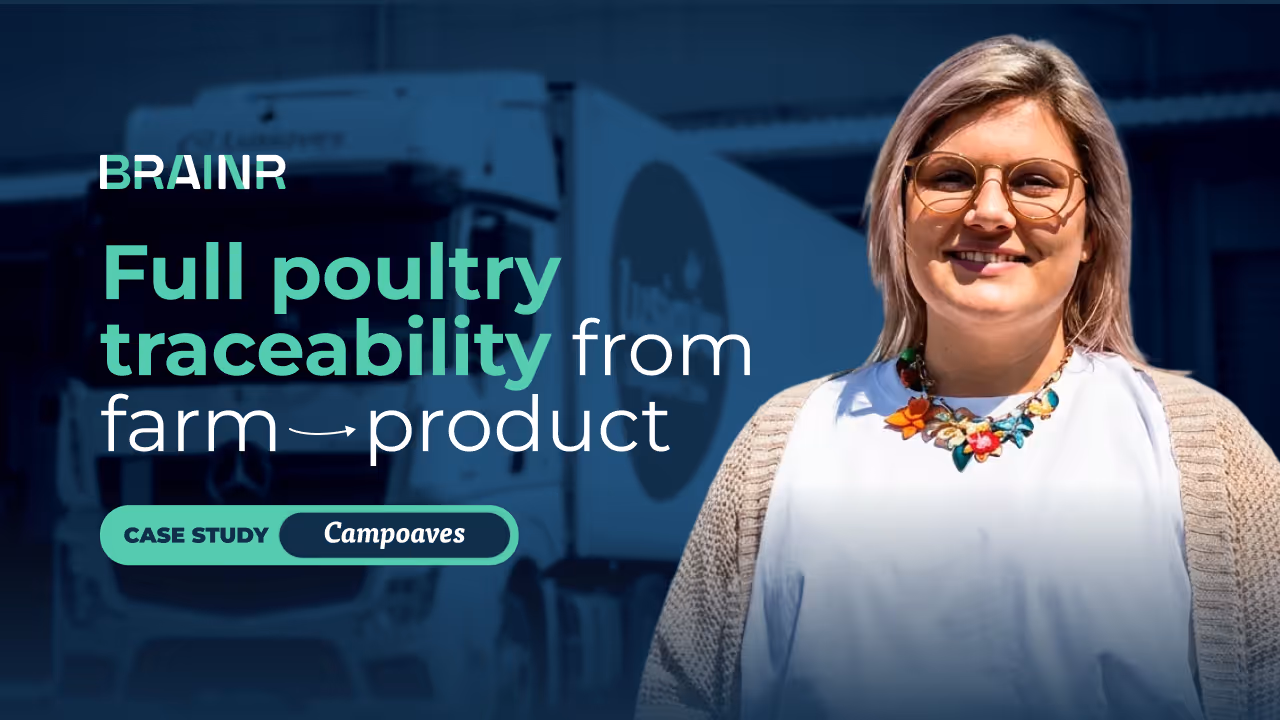
From Full Traceability to IFS Certification: The Success Story of Campoaves Viseu + BRAINR
Campoaves Viseu is a Portuguese poultry processing company producing 100% fresh products for major retailers, fully digitised with BRAINR in 4 months and IFS certified.
.avif)
From 40,000 to 190,000 Birds per Day: How Avisabor Digitised Its Entire Operation with BRAINR
Avisabor is a large-scale Portuguese poultry slaughterhouse supplying major retailers across Portugal and Spain.

Stay Ahead with Fresh Insights
Dive into our blog for stories, lessons, and behind-the-scenes insights from real projects. It’s where we share what’s working — and what we’ve learned along the way.


FAQs: Better Slaughter Decisions
Quick Answers for Curious Minds

Yes. BRAINR can receive flock, weight and prediction data automatically from most farm systems.
By planning based on actual size distributions, you avoid producing cuts that don't match real carcass sizes.
No. Data is auto-populated via integration with the farm software.
Yes. BRAINR shows predicted vs. actual weight, uniformity and category side by side.
Yes. Performance metrics such as uniformity, live weight deviation and delivery accuracy can be reviewed by farm and catch teams.
More accurate slaughter planning improves cutting yields, packaging efficiency, labour planning and order fulfilment.
We know your struggles. They once were ours.
We understand the challenges you face because we've been there too. Our journey has taught us valuable lessons that we're eager to share.