
Increase yield and reduce waste in every shift.
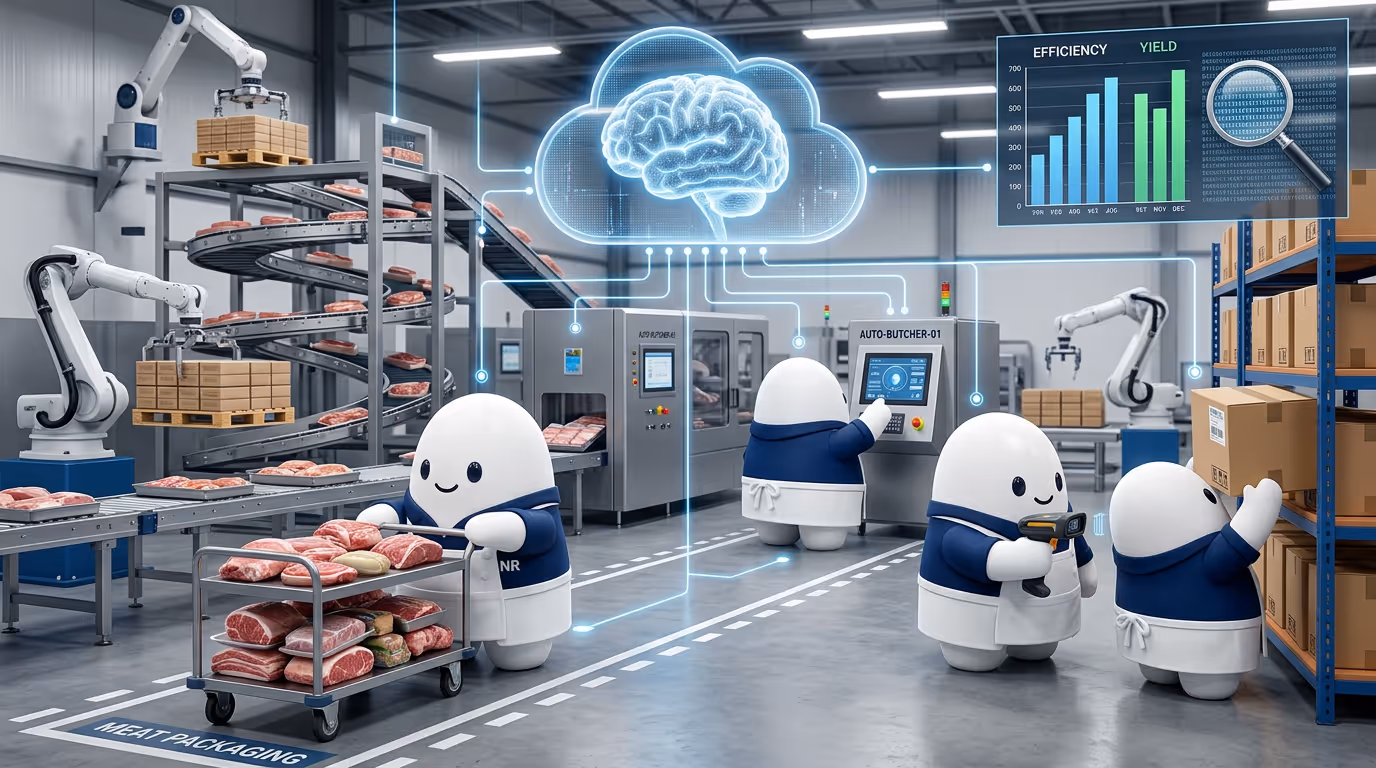
Every factory knows that output is what drives margin — but very few teams have real-time visibility on which shift, line or order is actually generating (or destroying) profitability. BRAINR gives you the data to understand performance clearly, and more importantly, to build strategies that systematically improve yield and reduce waste across the entire plant.

Key Challenges in Improving Yield and Reducing Waste, Solved with BRAINR
.avif)
Yield varies significantly across shifts, lines or teams
Waste and giveaway are poorly tracked

Staff are unaware of the economic impact of their performance
Core BRAINR Features for Improving Yield
Automatic registration of inputs and outputs
All materials entering and leaving each production line are captured automatically or via mobile apps, eliminating errors and capturing true yield.
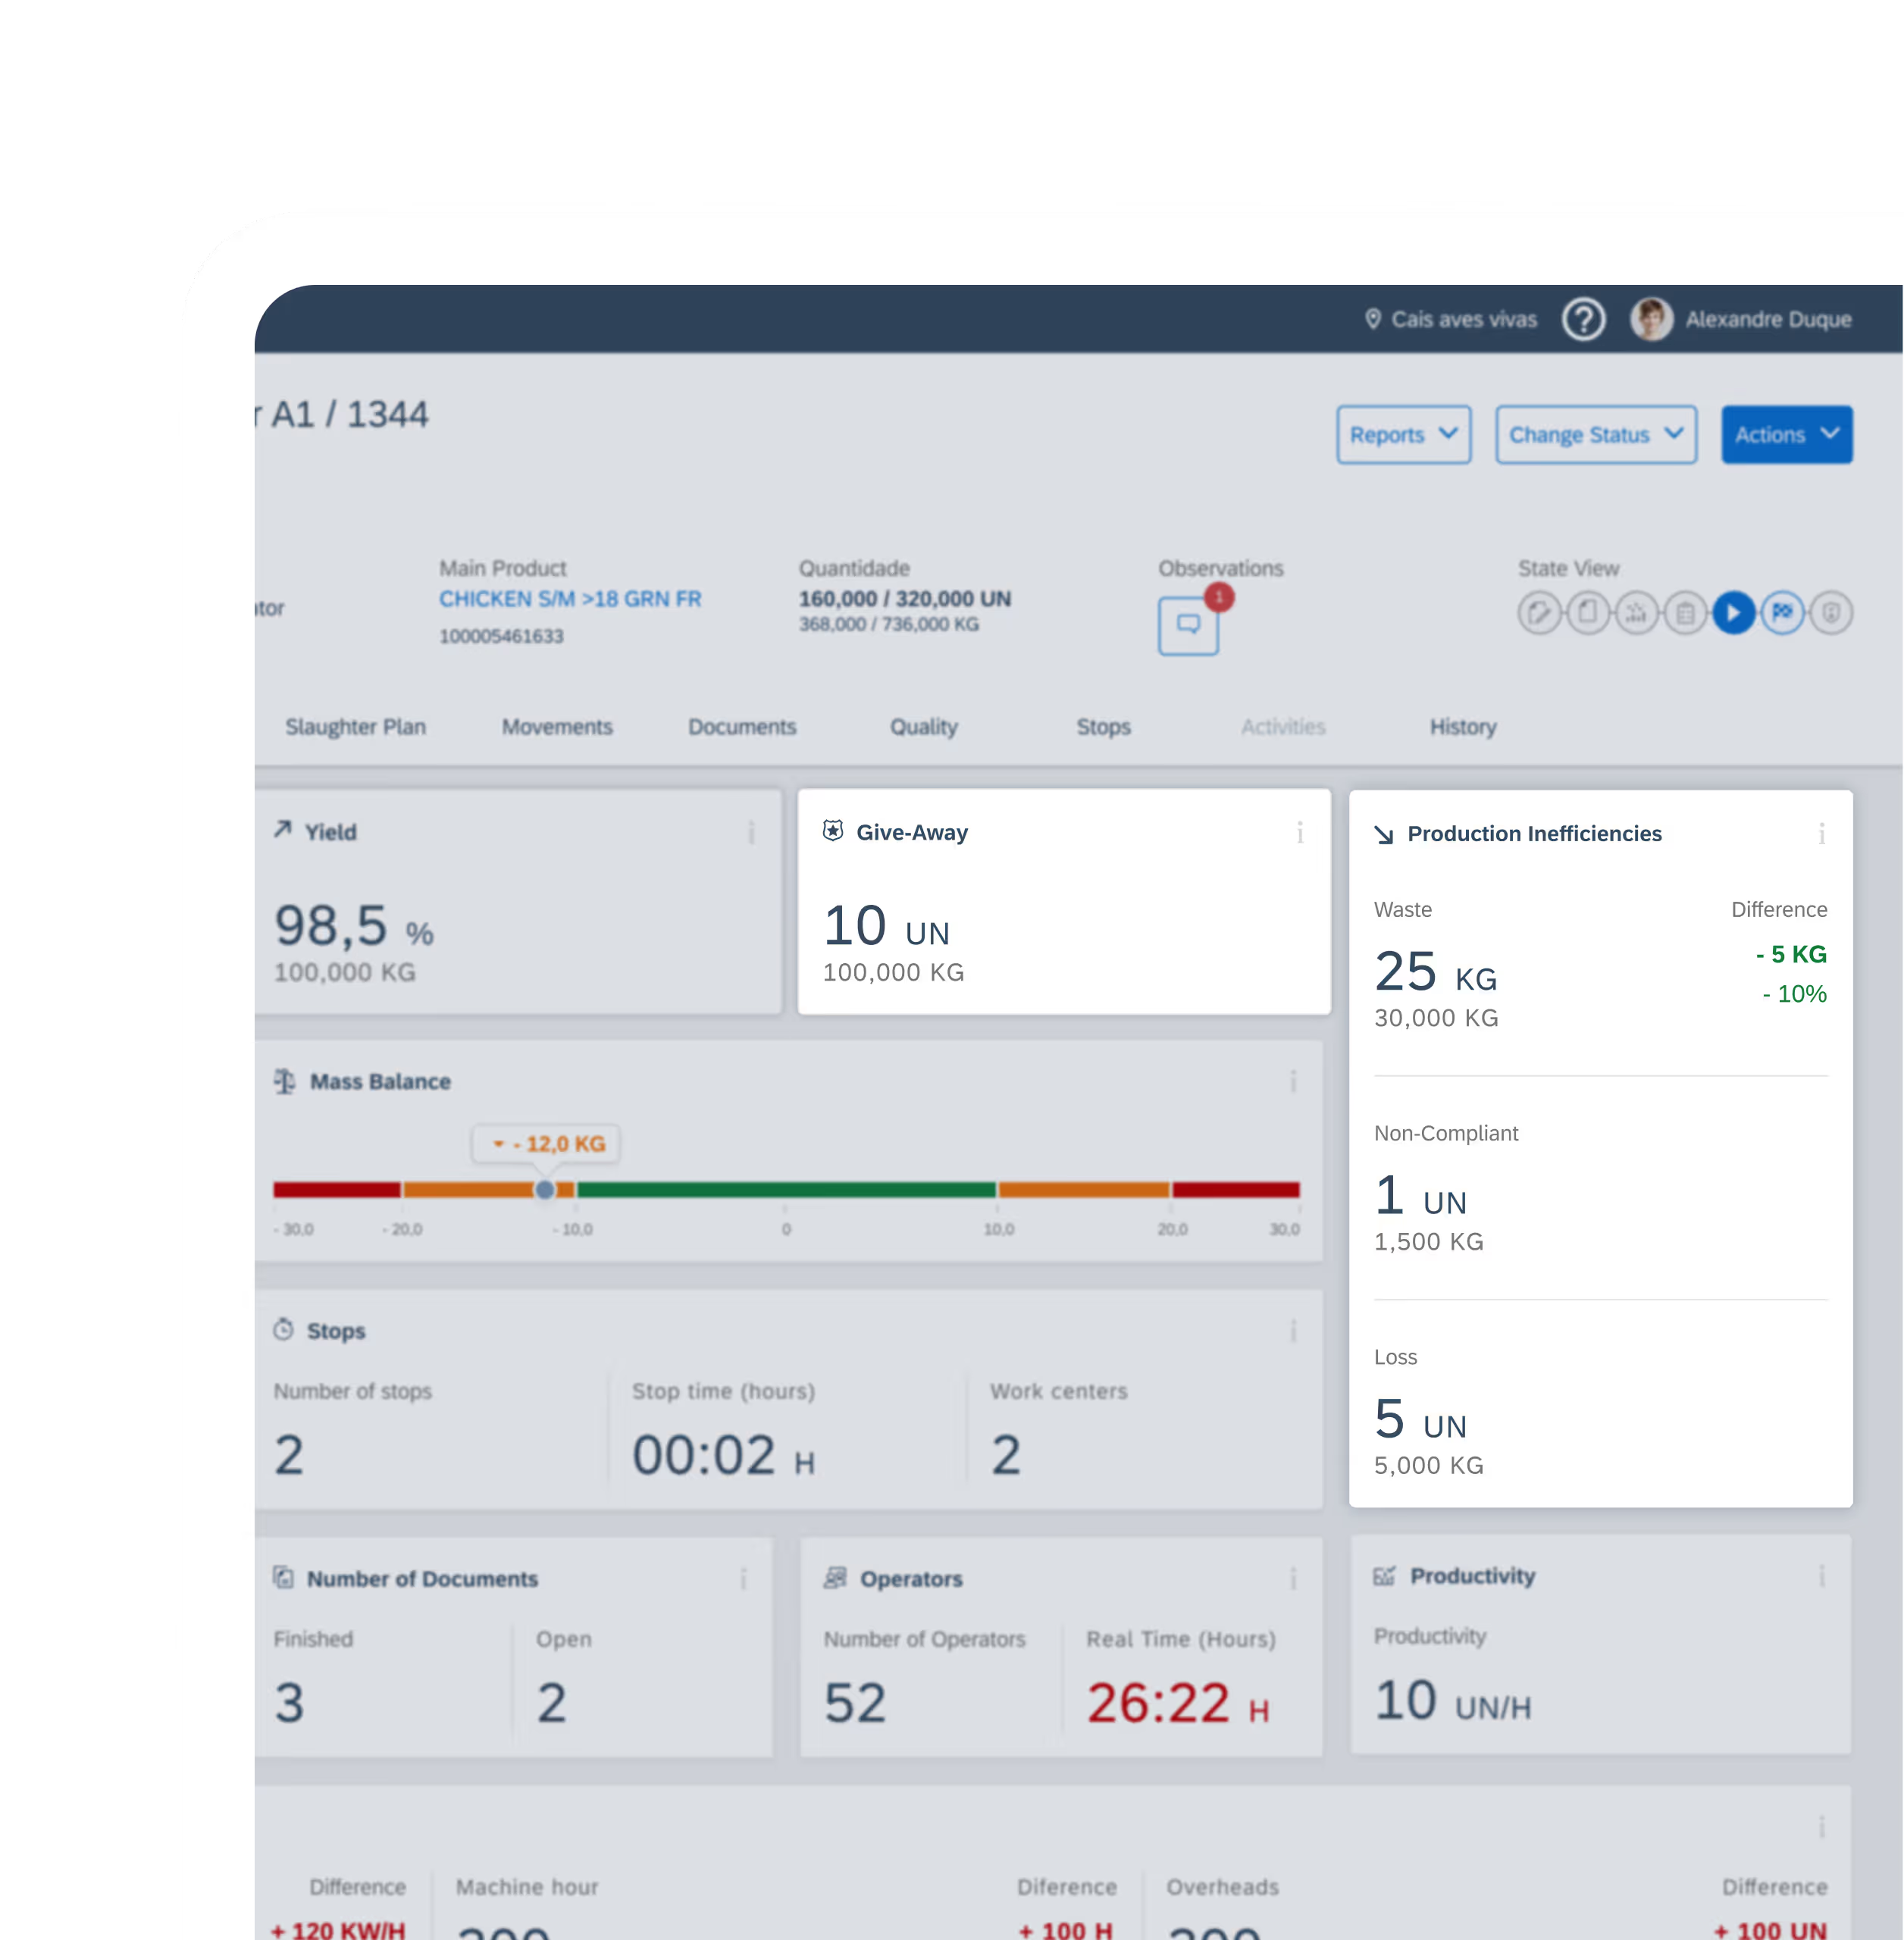
Real-time visibility of yield, waste and giveaway
Teams monitor live performance for every line, shift and production order, giving managers immediate insight into where value is created or lost.
Deep analytics to understand what works
Dashboards highlight patterns, bottlenecks, operator differences, line behaviour and recurring issues, enabling targeted improvement strategies.
Historical comparison and trend analysis
Shift-over-shift, day-over-day and line-over-line comparisons help identify persistent issues and opportunities for optimization.
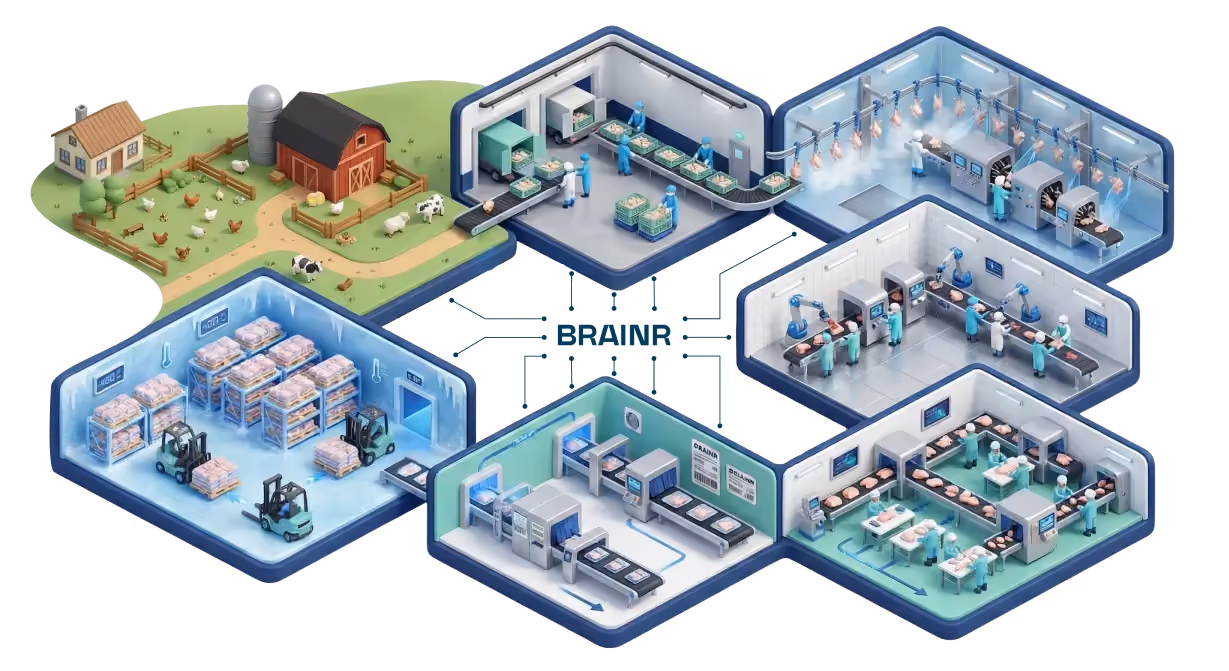
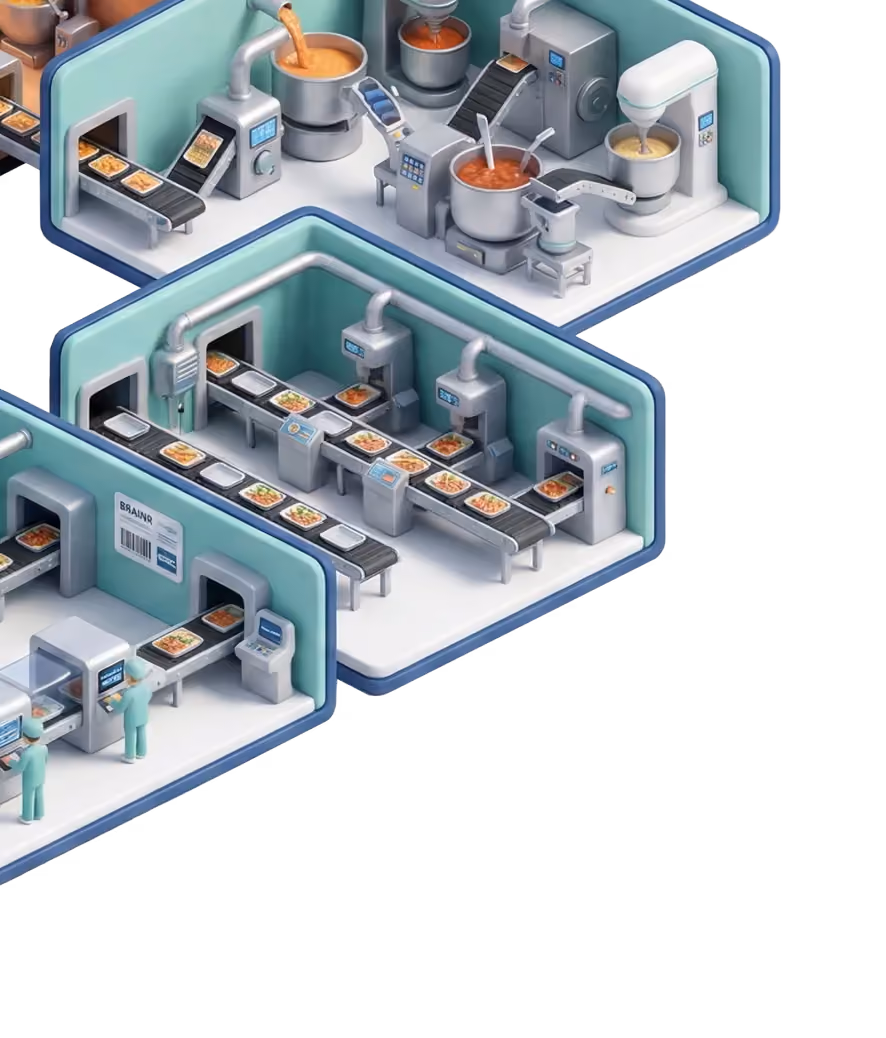
Unified data across all factory sections
From receiving to production to packaging, all yield-related data lives in one system, ensuring consistency and eliminating spreadsheet reconciliations.
Support for reprocessing and co-product management
The system captures by-products, rework and recovery operations, ensuring they contribute to the overall yield picture.
Why BRAINR is Different
A complete view of yield across the entire factory
Most systems track only the main product. BRAINR captures inputs, outputs, subproducts, rework and waste in one place, giving a true picture of performance.
Real-time execution visibility, not after-the-fact reporting
Teams react as deviations appear — not days later. This prevents escalation and stops small losses from turning into systemic issues.
Built for continuous improvement
BRAINR gives production, quality and continuous improvement teams the data they need to understand where to intervene and how to sustain improvements.
How it Works in Practice
How does it work in practice?
Detailed MPS and MRP planning
Yield optimization starts with realistic planning based on real stock, sales and production capabilities.
Real-time execution tracking
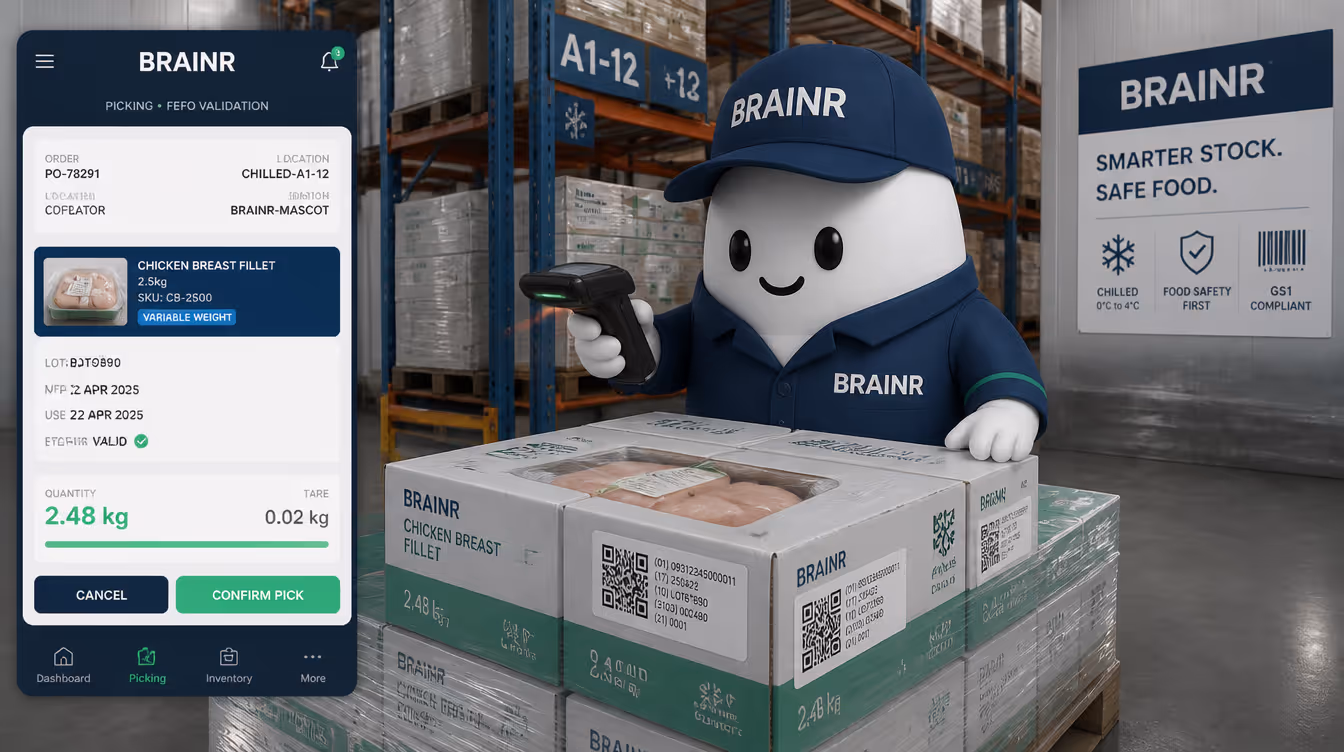
Operators register outputs, waste and adjustments using mobile apps, while the system captures data from equipment automatically.
Accurate stock and expiry management
All production outputs update stock levels and shelf life information in real time, ensuring traceability and accurate yield calculations.
What our clients say
reduction of time spent on quality and traceability tasks

increase in daily bird slaughter volume without loosing control

reduction of time spent on quality and traceability reporting

.svg)

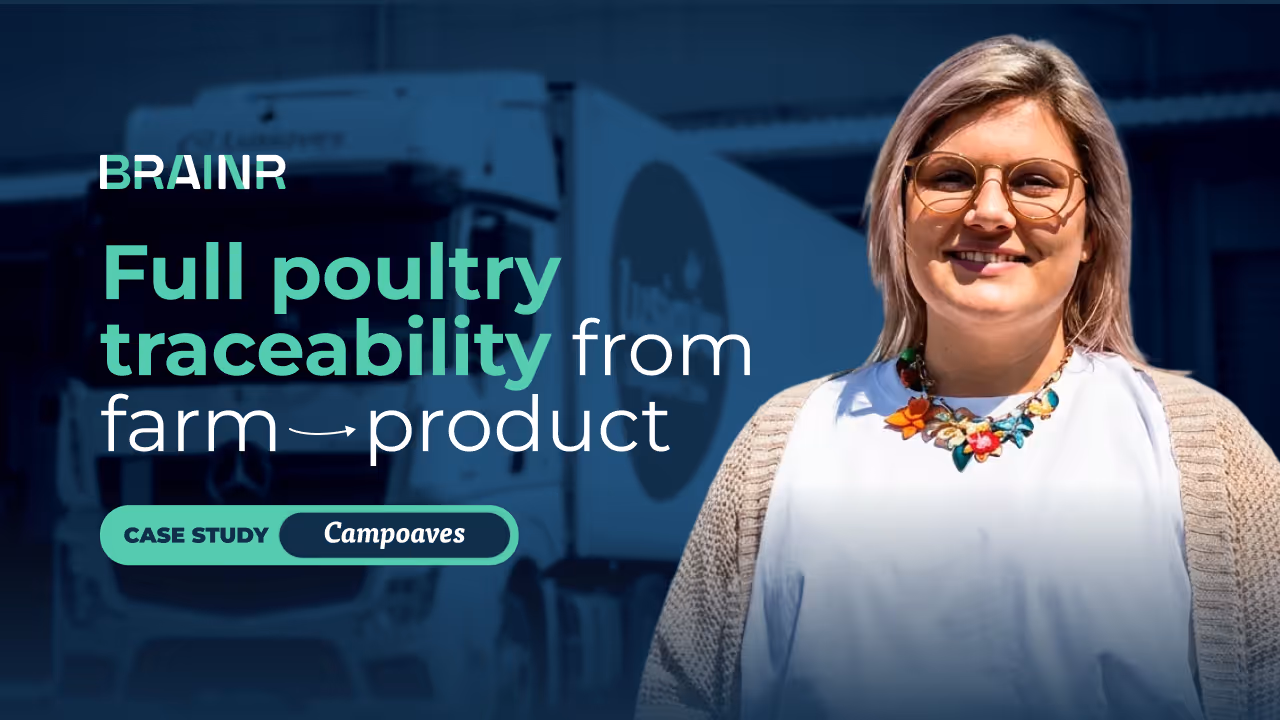
From Full Traceability to IFS Certification: The Success Story of Campoaves Viseu + BRAINR
Campoaves Viseu is a Portuguese poultry processing company producing 100% fresh products for major retailers, fully digitised with BRAINR in 4 months and IFS certified.
Campoaves: Digitizing Complex Poultry Operations with BRAINR MES/MOM
"With BRAINR’s digitalization, controlling production orders became much more dynamic, helping us avoid waste of raw materials and labor."

Stay Ahead with Fresh Insights
Dive into our blog for stories, lessons, and behind-the-scenes insights from real projects. It’s where we share what’s working — and what we’ve learned along the way.


FAQs — Increase Yield & Reduce Waste
Quick Answers for Curious Minds

By capturing all inputs, outputs, waste and rework automatically or via mobile apps, ensuring nothing is missed.
Yes. Yield, waste and giveaway can be compared across shifts, lines, operators and production orders.
Yes. Analytics highlight patterns, recurring issues and deviations that point to specific equipment, products or teams.
No. Most data is collected automatically from equipment or through simple, fast mobile workflows.
Yes. Co-products, reprocessing and recovery steps are integrated into the yield calculation.
Immediately. Real-time dashboards and alerts show yield and waste deviations as they happen.
We know your struggles. They once were ours.
We understand the challenges you face because we've been there too. Our journey has taught us valuable lessons that we're eager to share.