The word BRAINR in bold uppercase dark blue letters.
Solutions
Use-cases
Easy Production Scheduling

Plan and reschedule your productions effortlessly.

Better Slaughter Decisions

Make better slaughter decisions with real farm data.

Increase Yield & Reduce Waste

Increase yield and reduce waste in every shift.

Protect Animal Welfare

Protect animal welfare and meet regulatory expectations.

Standardize Best Practices

Standardize best practices across plants and shifts.

Simplify Compliance

Simplify food safety compliance & audits (HACCP, BRC, IFS, FSMA).

View even more use-cases

See all use-cases that BRAINR covers

Industries
Poultry

Run your poultry production always on time.

Pork & Beef Processing

Control every carcass, every cut, every gram of value.

Fish & Seafood

Take full control of freshness, yield and cold chain performance.

Pre-cooked & Ready Meals

Deliver ready meals with absolute consistency and traceability.

Industrial Bakery

Turn every batch into your best batch.

Fuits & Vegetables

Gain more control over your fruit and vegetable production.

Beverages

Run faster, cleaner and more accurate beverage operations.

Man with glasses and beard wearing a black Tiffosi sweatshirt sitting in front of a green wall with partial 'aves' sign.
Campoaves brand logo
Success Story

The partnership that digitized Portugal’s #1 free-range chicken poultry plant

See Case Studies
Product
Modules
Traceability & Compliance

Traceability and compliance that builds customer trust.

Advanced Production Planning (APS)

Set accurate plans and guide your production lines through the day.

Production Management Software (MES)

Real-time execution control that protects yield, freshness and service level.

Warehouse Management System (WMS)

Run a warehouse that moves fast, stays accurate and ships every order as promised.

Slaughter & Animal Management System

Elevate your live animal processes with precise control over welfare and yield.

Quality Management System (QMS)

Quality controls that keep every batch consistent and your factory audit ready.

Platform
Mobile-Native Apps (Android)

Mobility That Transforms How Your Factory Runs.

Cloud-Native Infrastructure

Secure & Scalable Cloud-Native Infrastructure

AI-Powered Factory Management

Higher-quality decisions with consolidated information in seconds

Configurability & Customization

Because no two factories are the same

IoT and Equipment Integrations

Automate what slows your factory down.

Best-in-Class UI/UX

100% Platform Adoption by Operators

Reports and Analytics (BI)

Reliable Data to Manage and Track Factories, from “A-Z”

Man with glasses and beard wearing a black Tiffosi sweatshirt sitting in front of a green wall with partial 'aves' sign.
Campoaves brand logo
Success Story

The partnership that digitized Portugal’s #1 free-range chicken poultry plant

See Case Studies
Pricing
Resources
Resources
3D icon of a document with a gold star on the top left corner.
Articles

Guides, insights, and practical knowledge to improve operations.

Red and blue rocket launching with smoke on a white base.
Case Studies

Real examples of teams achieving measurable improvements with BRAINR.

Man standing at a podium speaking to five seated people in a meeting or presentation.
Events

Meet us at industry events, conferences, and selected partner sessions.

Smiling man in a blue shirt working on a laptop at a wooden desk in a modern office with large windows and bookshelves.

Get support and find answers.

Help center
Person typing on a laptop keyboard with digital document icons floating above.

Download full capability sheet

Free download
Man with glasses and beard wearing a black Tiffosi sweatshirt sitting in front of a green wall with partial 'aves' sign.
Campoaves brand logo
Success Story

The partnership that digitized Portugal’s #1 free-range chicken poultry plant

See Case Studies
Company
Resources
About us

Who we are, why we built BRAINR, and what drives us.

Careers

Join our team and help shape the future of food production.

Partner & Services

Certified partners, integrations, and services to support your rollout.

Contact us

Get in touch with our team for questions or inquiries.

Book a demo

See BRAINR in action and explore your use cases live.

Join the Team

Together we make food production more efficient and reduce waste

Apply at BRAINR
Smiling man in a navy blazer and white shirt with arms crossed, wearing a smartwatch, seated indoors.
Why we built BRAINR

After decades in food factories, we saw leaders struggle with digitization.

Learn more
Free Consultation
Dark blue background with scattered light blue abstract shapes resembling the letters U and I.
Immediate visibility
Real production efficiency
Performance score

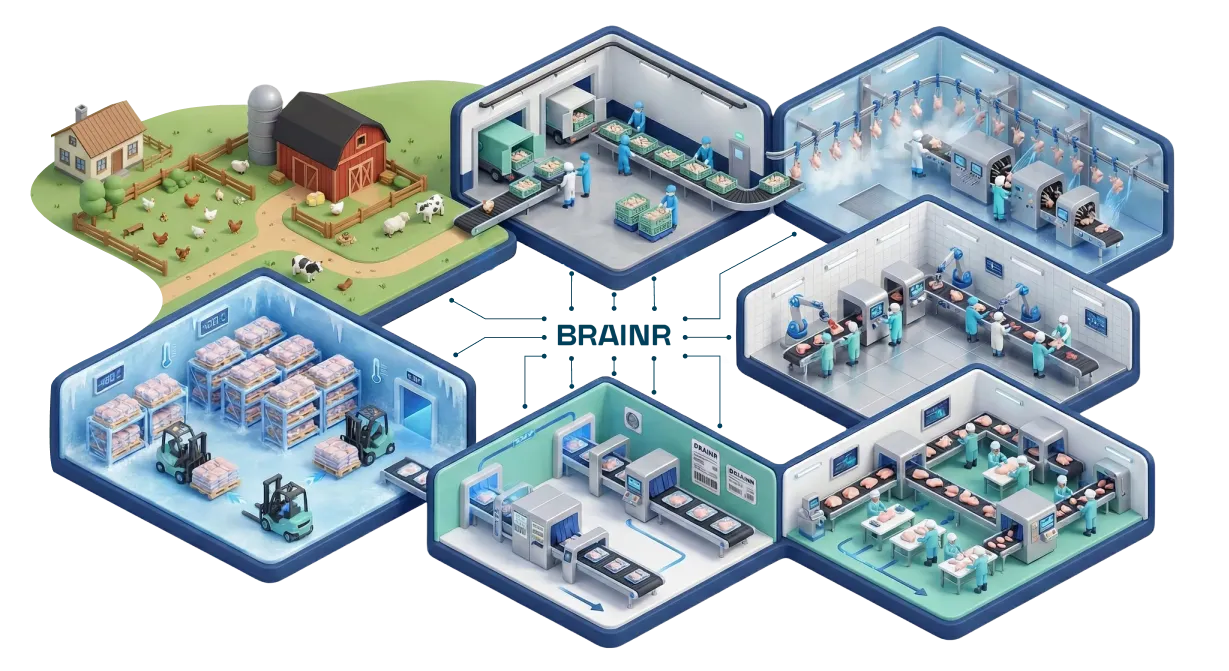
Overall Equipment Efficiency (OEE)

BRAINR measures the real efficiency of every line, machine and work center in real time. Availability, performance and quality are combined into a single, accurate view of how your factory is truly running.

Get started
Immediate visibility
Real production efficiency
Performance score

Main Features

Real-time OEE calculation

Availability, performance and quality are calculated continuously from real production data, consumptions, timings and machine events.

Dashboards by line, shift and section

Instant comparison between actual OEE and target OEE, with breakdowns by operator, team, product, equipment and time period.

Stoppage classification and analysis

Planned and unplanned stoppages are recorded automatically or via mobile and classified by reason, duration and frequency.

Integration with production equipment

Sensors, scales, labelers and mobile devices feed data directly into BRAINR without manual input, ensuring reliable and continuous metrics.
Additional Features

How BRAINR Tackles the Challenges of Poultry Production

Production planning results interface showing timeline schedules for different work centers including slaughter, cutting, and packaging tasks.

Yield Losses in Deboning

With BRAINR, every kilo that enters is recorded and tracked down to the final package. Monitor yield in real time and compare against defined standards — by cut type, by line, or by shift.

Learn more
Dashboard of production order for manual A1 cuts showing production summary, yield at 99.1%, weight balance, stoppages, and quality control data.

Stock Sitting Idle

Avoid excess with dynamic MPS/MRP plans that update automatically based on real orders, shipments, and consumption. With lot-level shelf-life alerts, decisions are made before waste occurs.

Learn more
Dashboard screen showing a list titled 'List of Open Production Needs Planning' with columns for Doc No, Name, Period, Start date, and End date, all rows containing similar data.

Overproduction

Excess production doesn’t happen by chance — it comes from planning failures. With BRAINR, every order is generated from real needs, whether forecasted or ERP-confirmed.

Learn more

Food-industry specific features

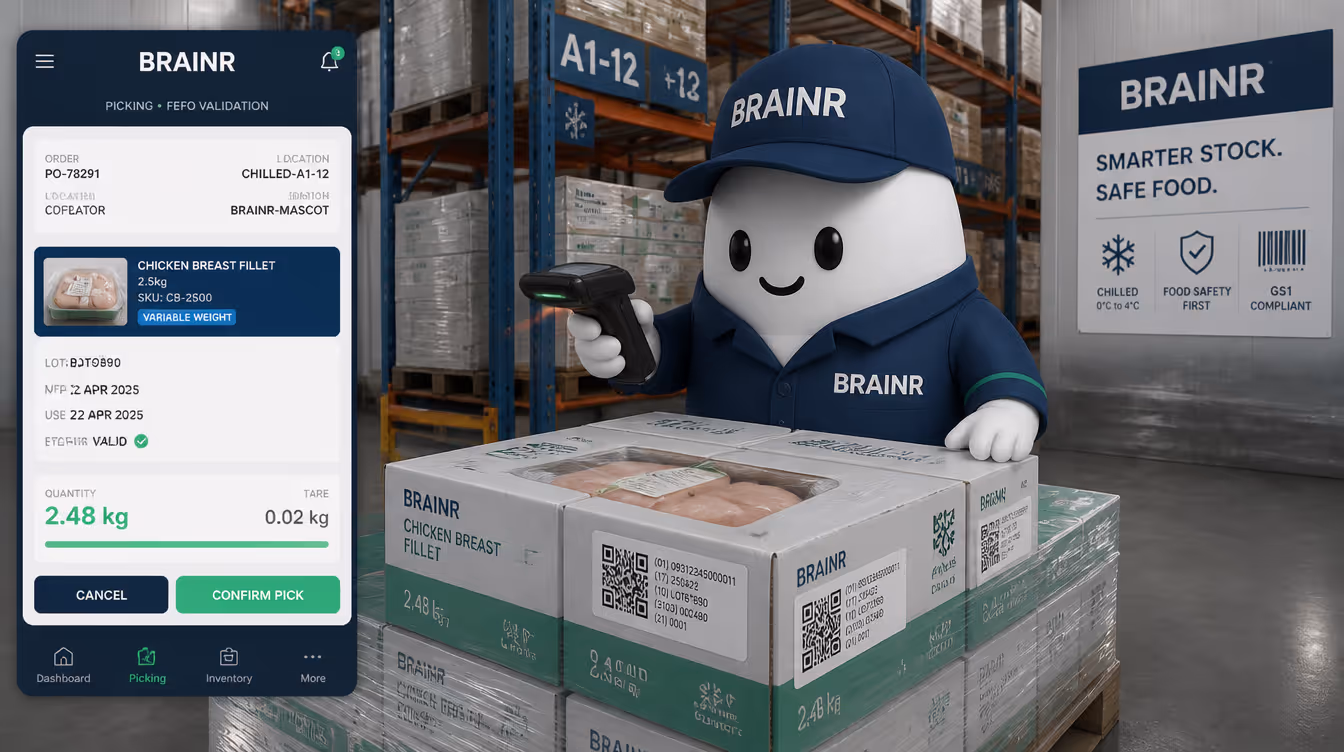
Performance analysis in variable-weight processes

Monitor efficiency in cutting, filleting, deboning or preparation operations where yield and weights fluctuate significantly.

Co-product and by-product traceability inside OEE

OEE automatically incorporates all outputs, including co-products and by-products, essential for meat, fish and vegetable operations where one order produces multiple items.

Real-time impact of waste on OEE

Waste recorded by operators updates the quality component of OEE instantly, making losses visible at the moment they occur.

Dynamic performance vs installed capacity

Performance is calculated based on real line capacity, considering product type, shift patterns and equipment differences.

Automatic classification of line events

Events such as stoppages, microstoppages, setups, format changes, cleaning and CIP are captured and classified automatically.

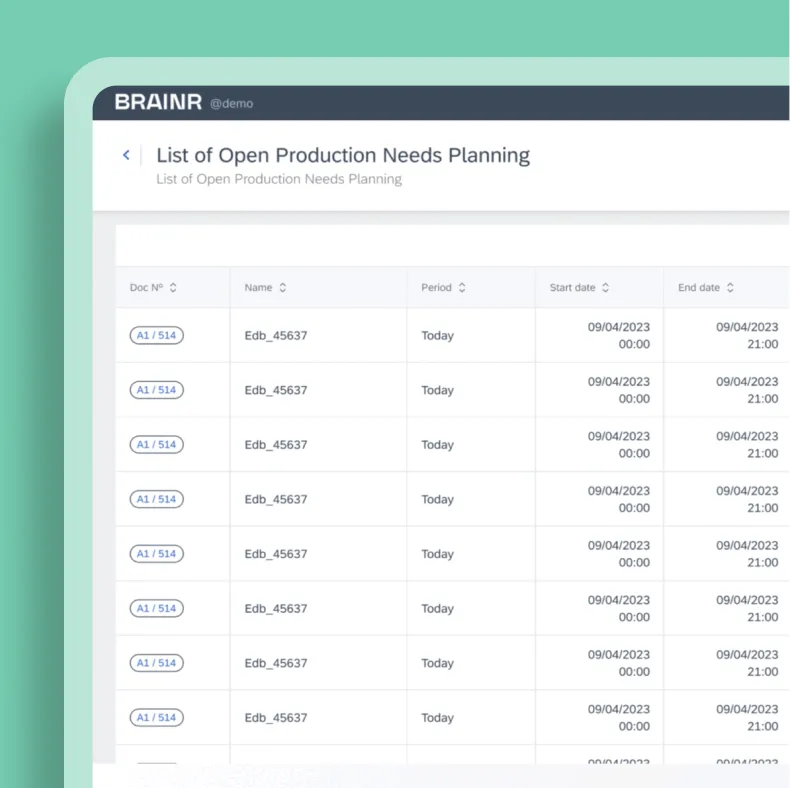
Full integration with production orders and ERP

OEE links directly to each production order and sends efficiency, losses and performance data to the ERP for costing and operational analysis.

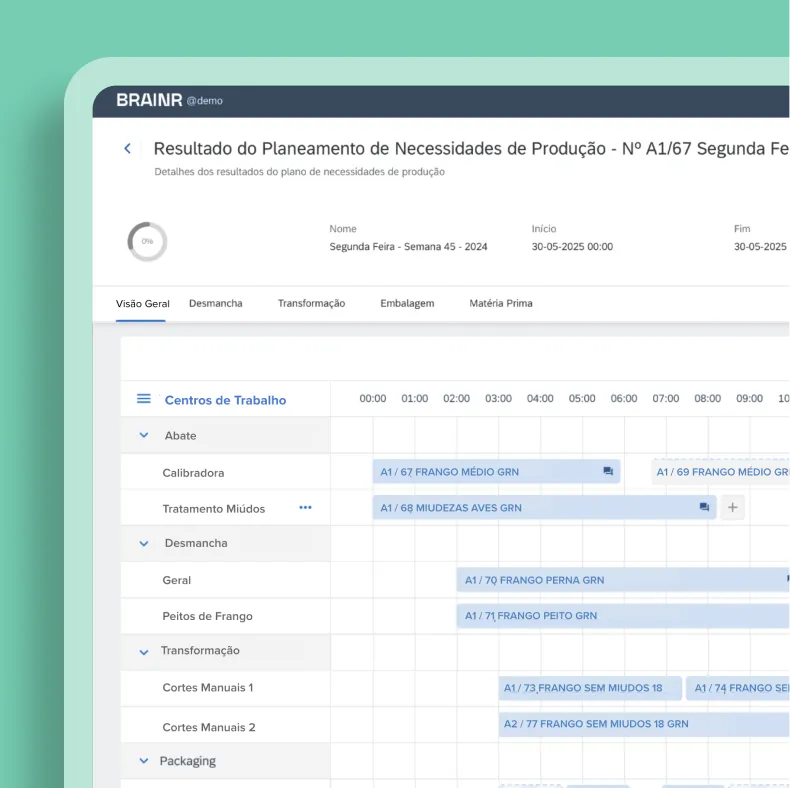
How it works in practice

0
1
2
3
01
Step 1

Shift starts with precise, live data

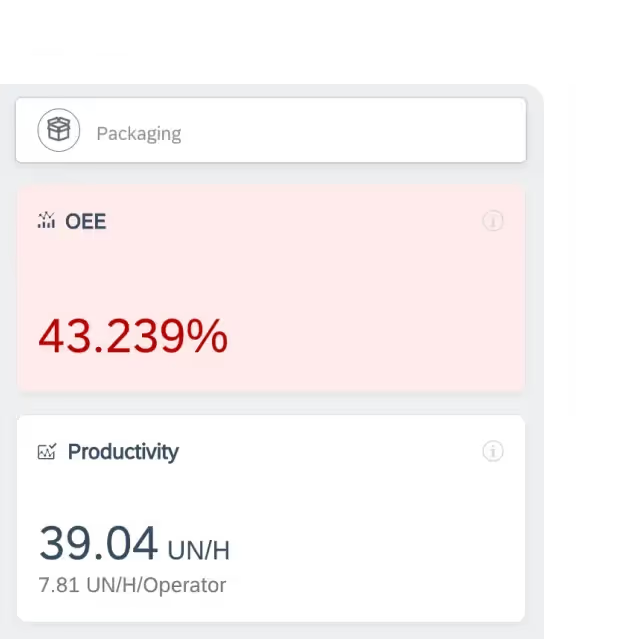
When the line begins, BRAINR immediately collects data on availability, pace and quality, calculating OEE in real time.

02
Step 2

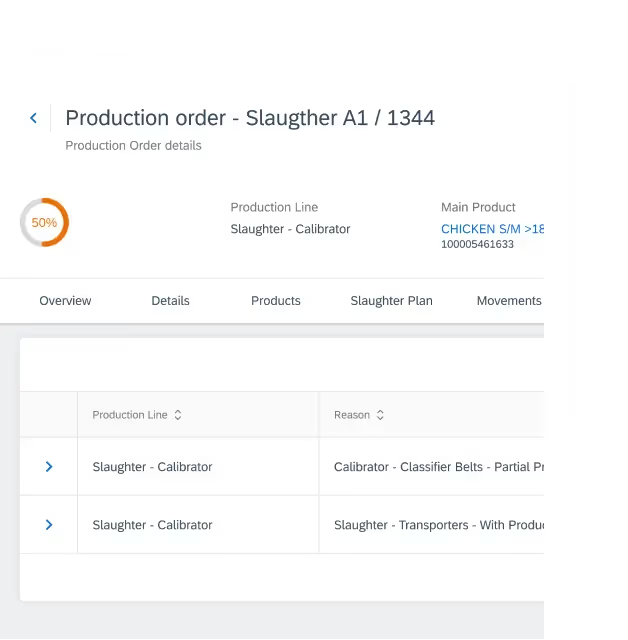
Automatic event capture and classification

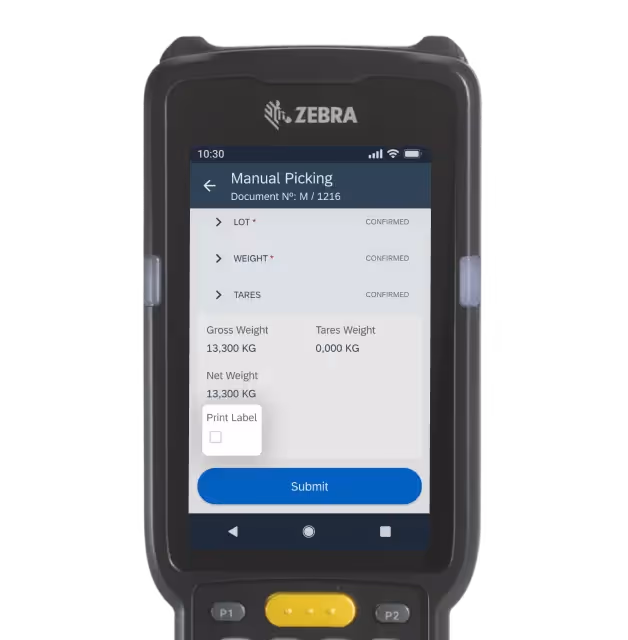
Stoppages, microstoppages, setups and format changes are recorded via machines or mobile devices, with configurable reasons and direct impact on OEE.

03
Step 3

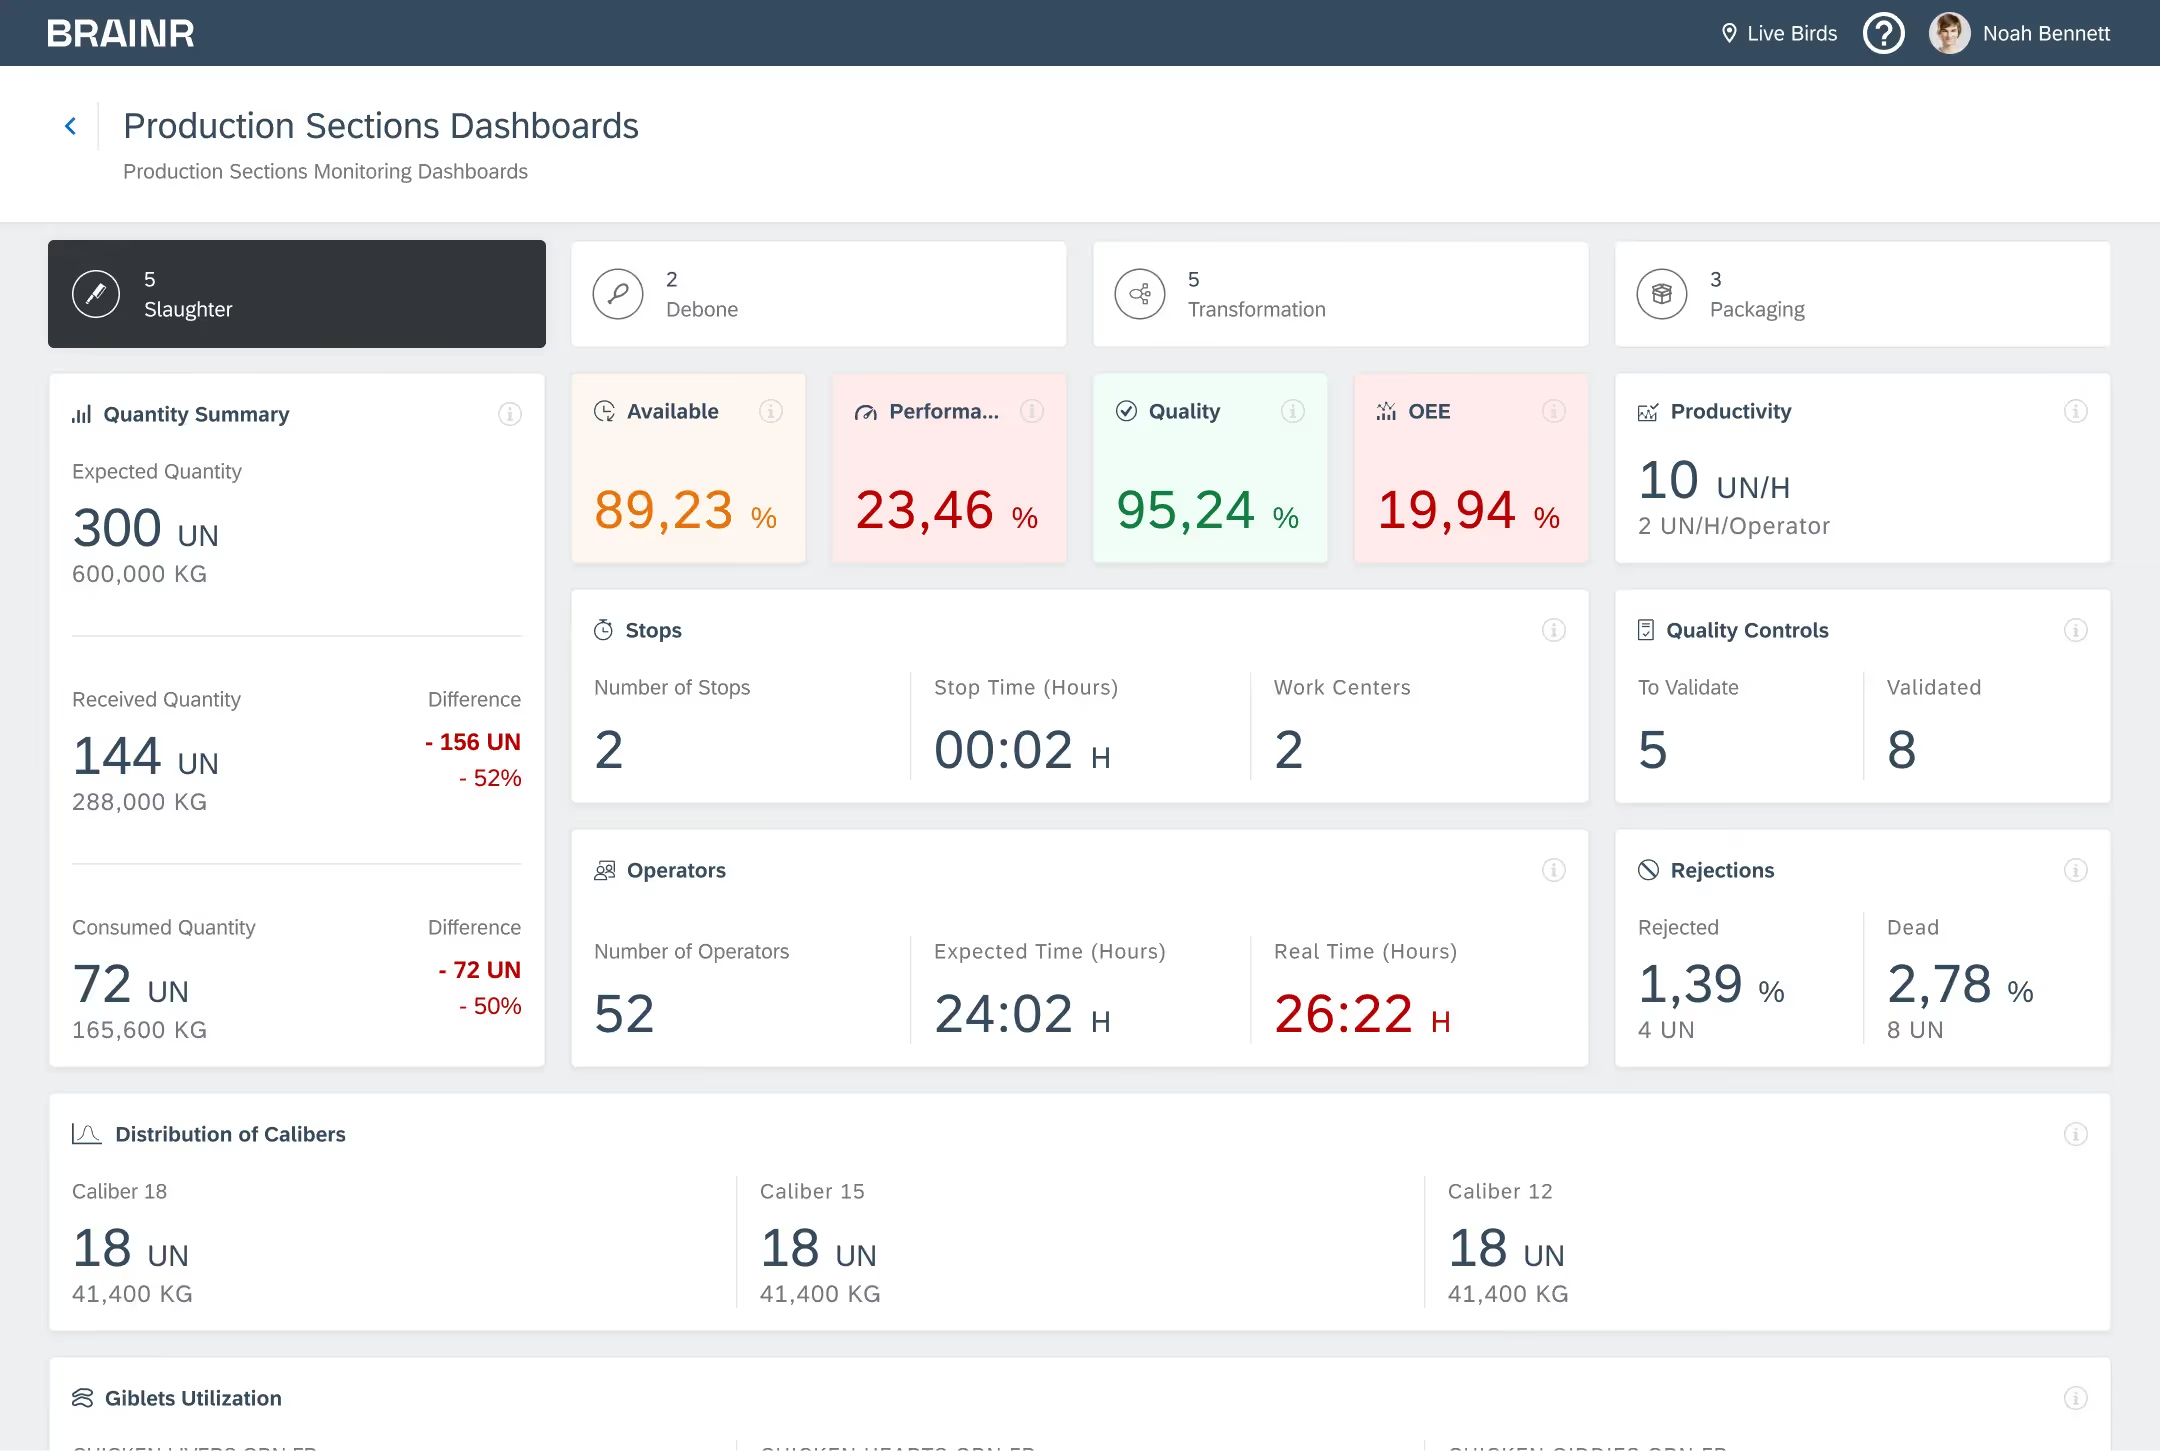
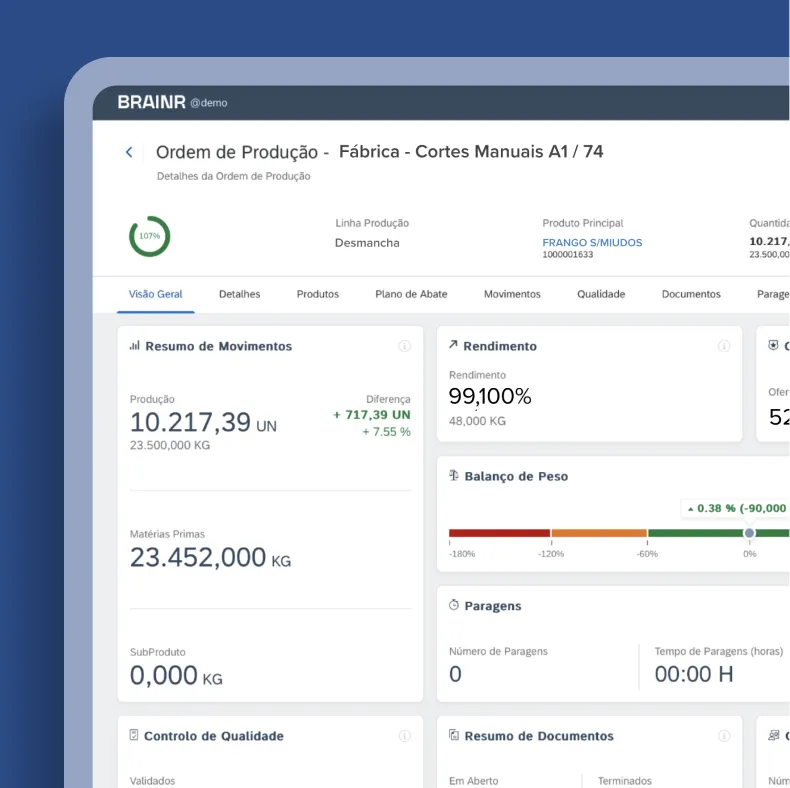
Line dashboards drive immediate action

Supervisors monitor second-by-second efficiency: real availability, actual pace vs ideal pace, quality, waste, co-products, by-products and operator performance.

FAQs: OEE

Quick Answers for Curious Minds

Smiling character with white rounded head, black eyes, wearing a blue hair net and blue outfit.
What is the best OEE system for food processing lines?

BRAINR delivers real-time OEE for food factories, capturing availability, performance and quality directly from equipment and mobile execution.

How can I measure OEE in real time instead of relying on manual spreadsheets?

BRAINR collects cycle times, stoppages, pace, waste and quality data automatically from machines and mobile apps and updates OEE every second.

How do food factories track stoppages and microstoppages accurately?

BRAINR records and classifies events from equipment and operators, including unplanned stoppages, microstoppages, setups, changeovers and cleaning.

What OEE tool works for variable-weight processes like cutting, filleting or deboning?

BRAINR is designed for protein and produce operations. It incorporates variable weights, fluctuating yield and multi-output processes into OEE calculations.

How can I identify the main causes of low efficiency in my production lines?

BRAINR breaks performance losses into stoppage losses, speed losses and quality losses and shows which factor is driving OEE down.

How does OEE link with yield and co-products in food manufacturing?

BRAINR includes co-products, by-products and waste in the OEE quality component, making yield loss visible in real time.

What system connects OEE with production orders and traceability?

BRAINR links every efficiency metric to the production order and batch, and integrates with the ERP for costing and operational analysis.

How can supervisors monitor real-time line performance across shifts?

BRAINR dashboards show live pace vs ideal pace, stoppages, losses, quality issues, operator performance and shift comparisons.

How do factories automate the classification of line events for OEE?

BRAINR classifies events automatically using machine data, and operators can refine or explain events with mobile entry.

How do I benchmark OEE across products, lines or plants?

BRAINR provides breakdowns by product type, line, equipment, operator and shift, enabling benchmarking and continuous improvement.

Still got questions?
Contact Sales
Anthropomorphic brain mascot wearing glasses and a blue jacket with BRAINR logo, reading a newspaper and wearing a light blue surgical cap.

Stay Ahead with Fresh Insights

Dive into our blog for stories, lessons, and behind-the-scenes insights from real projects. It’s where we share what’s working — and what we’ve learned along the way.

Articles
•
September 18, 2025

🦄 Congratulations to the BRAINR team for raising the largest seed round ever (11M EUR) to bring AI to food factories 🦄

Articles
•
July 31, 2025

🧞 ‍ What does it take to transform an industry?

Articles
•
July 6, 2025

🧀 Dairy Industry Monitoring volumes, times, yields and deviations with BRAINR

No items found.
See all resources
Isometric diagram showing poultry farm to factory process including farm with animals, packaging, processing, inspection, and cold storage linked by the BRAINR system.Isometric illustration of an automated food production line with machines mixing, cooking, and packaging ready meals on conveyor belts.
Abstract logo featuring a red triangular shape within a white, curved vertical frame.White letter M on a green circular background representing a logo.SAP company logoCompany logo with a bold white capital letter B on a black background.Company logo with stylized letter M in blue and orange orbit design.
Over €1B in Annual Food Production

We know your struggles. They once were ours.

We understand the challenges you face because we've been there too. Our journey has taught us valuable lessons that we're eager to share.

Get started
Dark blue gradient background with faint abstract shapes resembling the letters U and I scattered across.
Download Everything BRAINR can do. Transparent. Simple. Free.
Take the ShortcutDownload Capability Sheet
Man in a dark blazer and white shirt standing with arms crossed in a warmly lit modern office lounge.
Use Cases
Easy Production Scheduling
Better Slaughter Decisions
Increase Yield & Reduce Waste
Protect Animal Welfare
Standardize Best Practices
Simplify Compliance
End-to-end Lot Traceability
Inbound to Dispatch Visibility
Eliminate Labeling Errors
Reducing IT Complexity
Faster Team Productivity
Industries
Poultry
Pork & Beef Processing
Fish & Seafood
Pre-cooked & Ready Meals
Industrial Bakery
Fuits & Vegetables
Beverages
Product
Traceability & Compliance
Advanced Production Planning (APS)
Production Management Software (MES)
Warehouse Management System (WMS)
Slaughter & Animal Management System
Quality Management System (QMS)
Case Studies
Campoaves: Digitizing Complex Poultry Operations with BRAINR MES/MOM
How Lusiaves Group Transformed Planning and Production Across Its Factories?
The Digital Transformation of Grupo Lusiaves Shipping Process
Lusiaves Group: How Surprizingly Simple It Was Digitizing Factory Quality and Traceability
How The Nighmare Of Receiving Buying Orders And Managing Warehouse Transformed Into “Business-as-Usual” With BRAINR
Platform
Mobile-Native Apps (Android)
Cloud-Native Infrastructure
AI-Powered Factory Management
Configurability & Customization
IoT and Equipment Integrations
Best-in-Class UI/UX
Reports and Analytics (BI)
Company
About usCareersContact usPartners & Services
Legal
Legal Notice
Services Agreement
Master Subscription Agreement
Cookie Policy
Privacy Policy
Get Started
Book a DemoFree ConsultationGet in touchPricing
Resources
ArticlesCase StudiesEventsCapability Sheet
Brainr company logo with stylized letters in alternating white and green colors.
Logos for Centro 2020, Portugal 2030, and the European Union with text indicating European Union funding support.
© 2025 BRAINR